
Increasing Agricultural Productivity:
Encouraging Foreign Direct Investments in the COMCEC Region
31
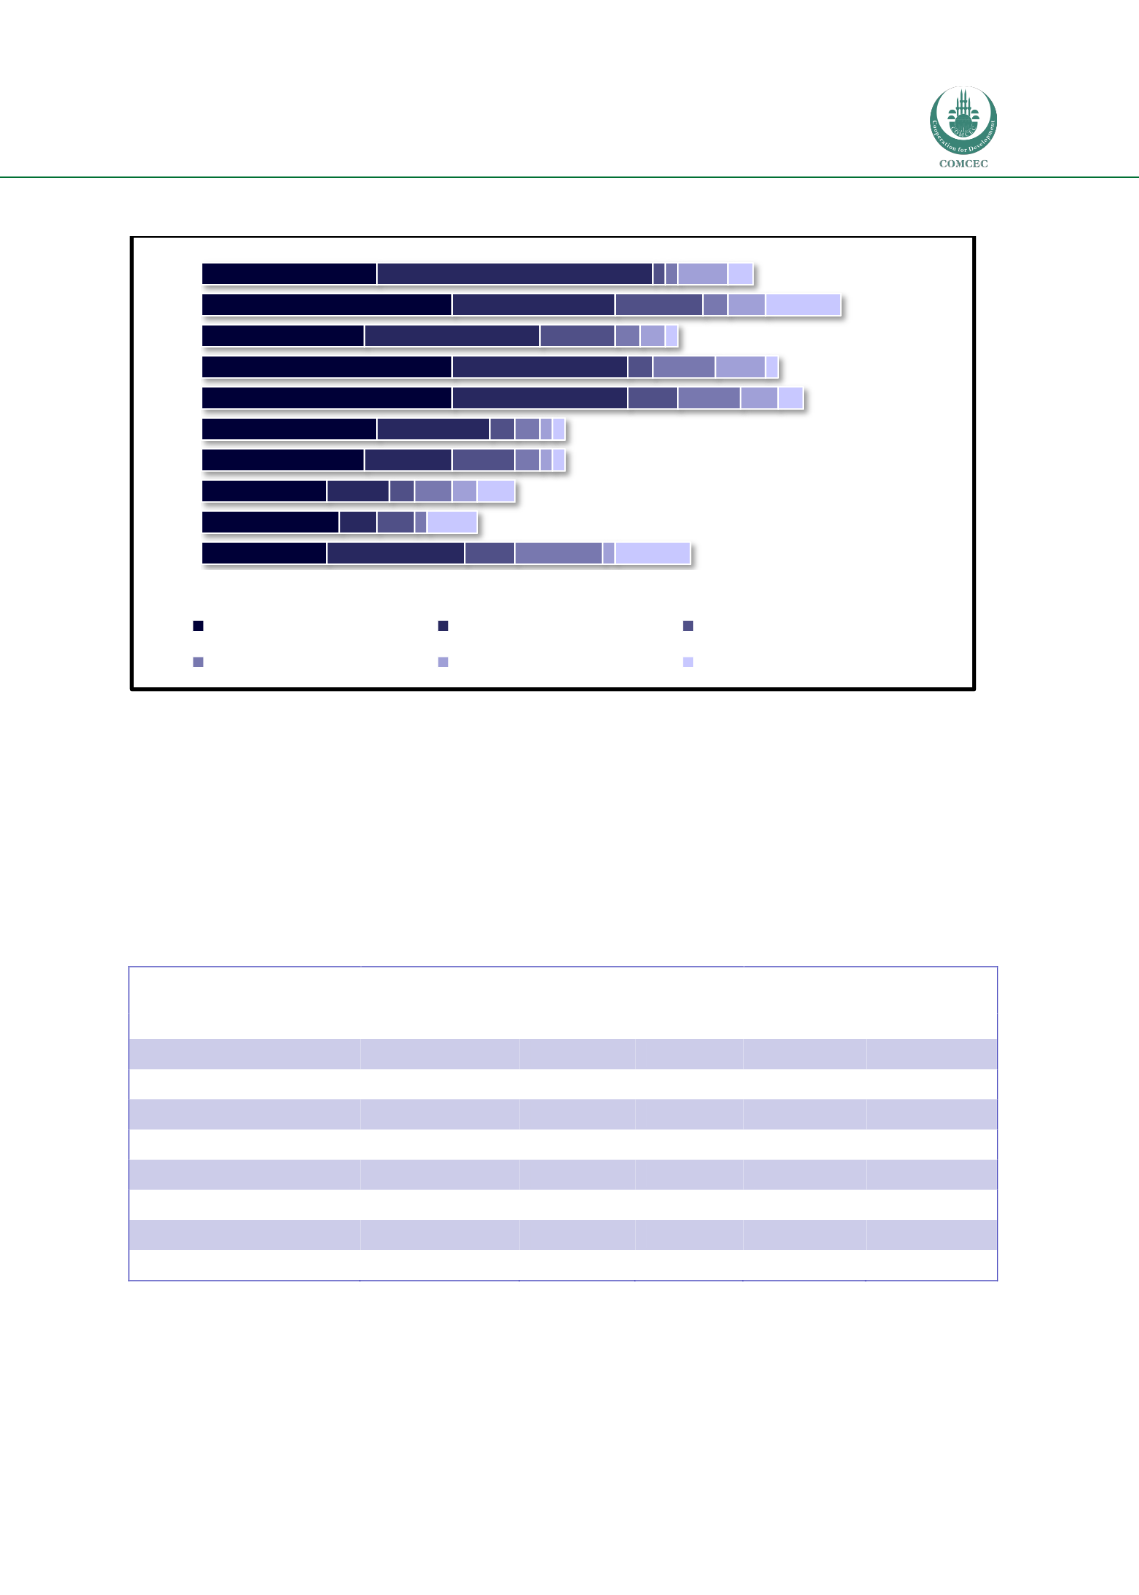
Figure 13: Number of Agricultural FDI Projects by Year and Destination World Region
Source: fDi Intelligence from The Financial Times Ltd
Asia-Pacific has generated the highest number of total jobs and greatest investment with a total
of 51,240 jobs and USD 21.23 billion in investment. Moreover, projects from the Middle East and
Asia-Pacific have the largest project size on average in terms of investment and jobs creation,
respectively. Western Europe accounts for the highest number of FDI projects (i.e. 145) in
absolute terms, however, these projects are not as labour and capital intensive as Asian and
Middle Eastern projects (see Table 9).
Table 9: Agricultural FDI Trends by Source World Region
Source world region
No of projects
Jobs Created
Capital investment
Total
Average
Total (USD)
m)
Average (USD)
m)
Western Europe
145
29,647
204
9,101.40
62.80
Asia-Pacific
112
51,240
457
21,235.90
189.60
North America
36
11,448
318
2,687.70
74.70
Middle East
30
11,430
381
6,457.10
215.20
Africa
21
8,925
425
3,631.40
172.90
Rest of Europe
21
2,237
106
1,458.00
69.40
Latin America & Caribbean
6
983
163
631.40
105.20
Total
371
115,910
312
45,202.90
121.80
Source: fDi Intelligence from The Financial Times Ltd
Out of a total of 63 source countries, the top five account for 40 percent of all FDI projects. As
illustrated in Table 10, Switzerland and the United States are the top sourcing countries
accounting for almost 20 percent of all projects tracked during the period 2003 – 2012. Other
10
11
10
13
14
20
20
13
20
14
11
3
5
7
9
14
14
14
13
22
4
3
2
5
2
4
2
6
7
1
7
1
3
2
2
5
5
2
2
1
1
2
1
1
3
4
2
3
4
6
4
3
1
1
2
1
1
6
2
2003
2004
2005
2006
2007
2008
2009
2010
2011
2012
Western Europe
Asia-Pacific
North America
Middle East
Africa
Other source world regions


