


 60 / 272

Reviewing Agricultural Trade Policies
To Promote Intra-OIC Agricultural Trade
48
in 2016. Two sharp increases are observed within the African group; the percentage share of
intra-OIC exports for fruit and nuts went from 9.38% in 2005 to 76.61% in 2016 and for bread
products from 16.70% to 85.08%.
However, for the African and Arab groups, out of the 15 observations on leading products, 7 of
them show reductions; for the Asian group, there are 10 reductions versus 5 increases. Still, the
fact that only in two of the 6 observations for the remaining products in the two categories “06”
and “04” show a reduction could be interpreted positively when added to the top 15 products.
The following patterns are identified by analyzing the distribution of existing preferential trade
agreements among the OIC countries (see Table 3.4): For the 52 OIC member countries with
data availability through RTA databases, the total number of agreements these OIC countries
have globally is equal to 1,144. A total of 454 of these agreements are with other OIC countries.
On average, an OIC member country has 22 preferential trade agreements globally, and 8.73 of
them on average are with other OIC members. The minimum and maximum numbers for the
total number of agreements are equal to 5 (Chad and Gabon) and 72 (Egypt), respectively. With
the OIC countries, the minimum and maximum numbers are equal to 1 (Albania, Guyana,
Palestine and Suriname) and 19 (Egypt). It has also been observed that ECOWAS and Pan-Arab
Free Trade Area countries have larger than average preferential trade agreements within the
OIC.
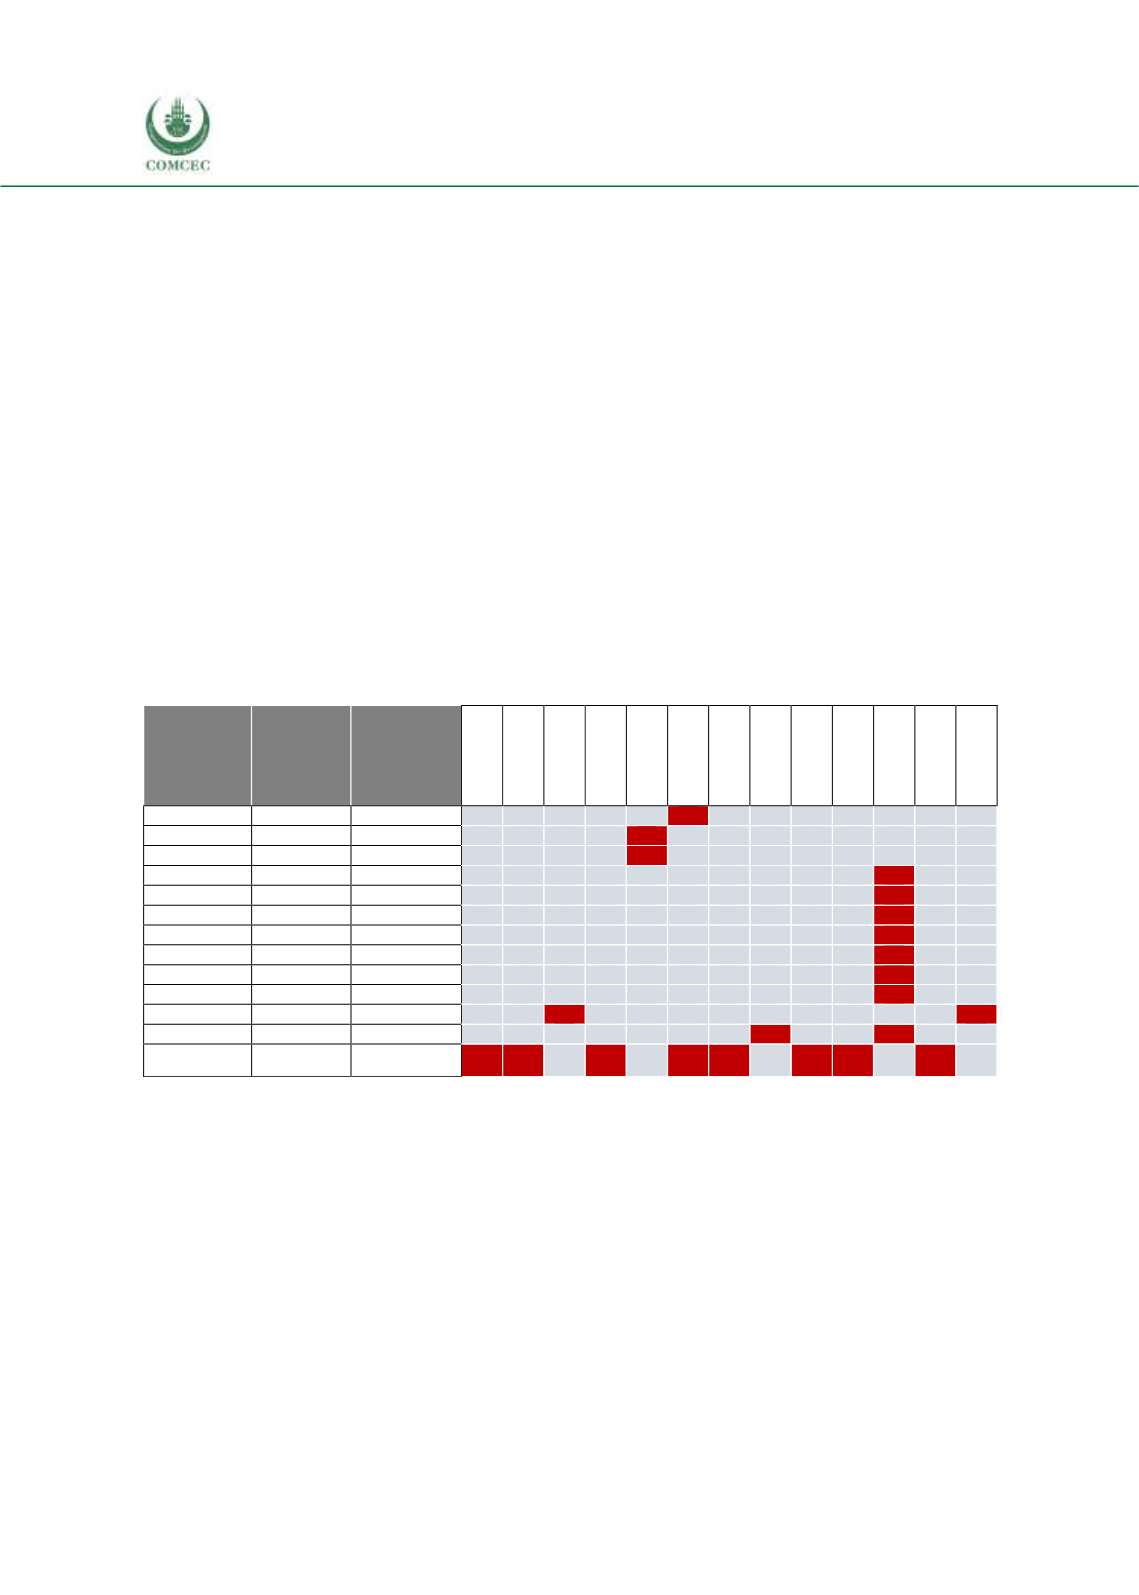
Table 3. 5 Within OIC Agreements Signed Not Due to Commitments to Third Parties
Signatory
OIC
country
Number
of
partners,
total
Number of
partners,
among OIC
members
Albania
Palestine
Kazakhstan
Jordan
Kyrgyzstan
Malaysia
Morocco
Pakistan
Syria
Tunisia
Turkey
Egypt
Uzbekistan
Pakistan
3
1
0
0
0
0
0
1
0
0
0
0
0
0
0
Uzbekistan
3
1
0
0
0
0
1
0
0
0
0
0
0
0
0
Kazakhstan
6
1
0
0
0
0
1
0
0
0
0
0
0
0
0
Syria
29
1
0
0
0
0
0
0
0
0
0
0
1
0
0
Albania
33
1
0
0
0
0
0
0
0
0
0
0
1
0
0
Palestine
33
1
0
0
0
0
0
0
0
0
0
0
1
0
0
Tunisia
33
1
0
0
0
0
0
0
0
0
0
0
1
0
0
Morocco
34
1
0
0
0
0
0
0
0
0
0
0
1
0
0
Jordan
36
1
0
0
0
0
0
0
0
0
0
0
1
0
0
Egypt
37
1
0
0
0
0
0
0
0
0
0
0
1
0
0
Kyrgyzstan
5
2
0
0
1
0
0
0
0
0
0
0
0
0
1
Malaysia
7
2
0
0
0
0
0
0
0
1
0
0
1
0
0
Turkey
51
8
1
1
0
1
0
1
1
0
1
1
0
1
0
Source: WTO Regional Trade Agreements Information System (RTA-IS)
Note: Reciprocal trade agreement between two OIC members, is shown with red shading of the respective
cell, otherwise it is shaded with blue.
Table 3.5 complements Table 3.4 by identifying the agreements signed not due to the
commitments made to third parties through non-OIC RTAs. Malaysia, for instance, is the
signatory of trade agreements with OIC member countries Turkey and Pakistan without being
required to have such agreements under some multilateral trade bloc commitments such as thse
of the ASEAN. It s easily seen that, among the OIC countries that are signatores of such
agreements, most countries have agreements only with a very small number of fellow OIC
members.