


 64 / 272

Reviewing Agricultural Trade Policies
To Promote Intra-OIC Agricultural Trade
52
The FAPDA tool covers three groups of policies. Consumer oriented policies are the policies that
aim to improve food security and nutrition. The consumer oriented policies cover measures
such as tax, social protection, market management, disposable income, nutritional and health
assistance. Producer oriented policies cover policy tools whose purpose is to support farmers.
The measures that are covered by producer oriented policies are production support, market
management, natural resources management and institutional and organizational measures.
The trade oriented policies whose aims are to support consumers and producers cover
measures directly affecting imports, exports, trade related measures and macroeconomic policy
decisions.
Table 3.7 presents the policies that are currently practiced in the OIC member countries
according to the available data from FAPDA. The figures reveal that there are a total of 167
producer oriented policies and 60 trade oriented policies. These numbers are again sensitive to
the number of countries for which data is available, but the plain averages across groups do not
exhibit considerable differences with respect to the policy orientation.
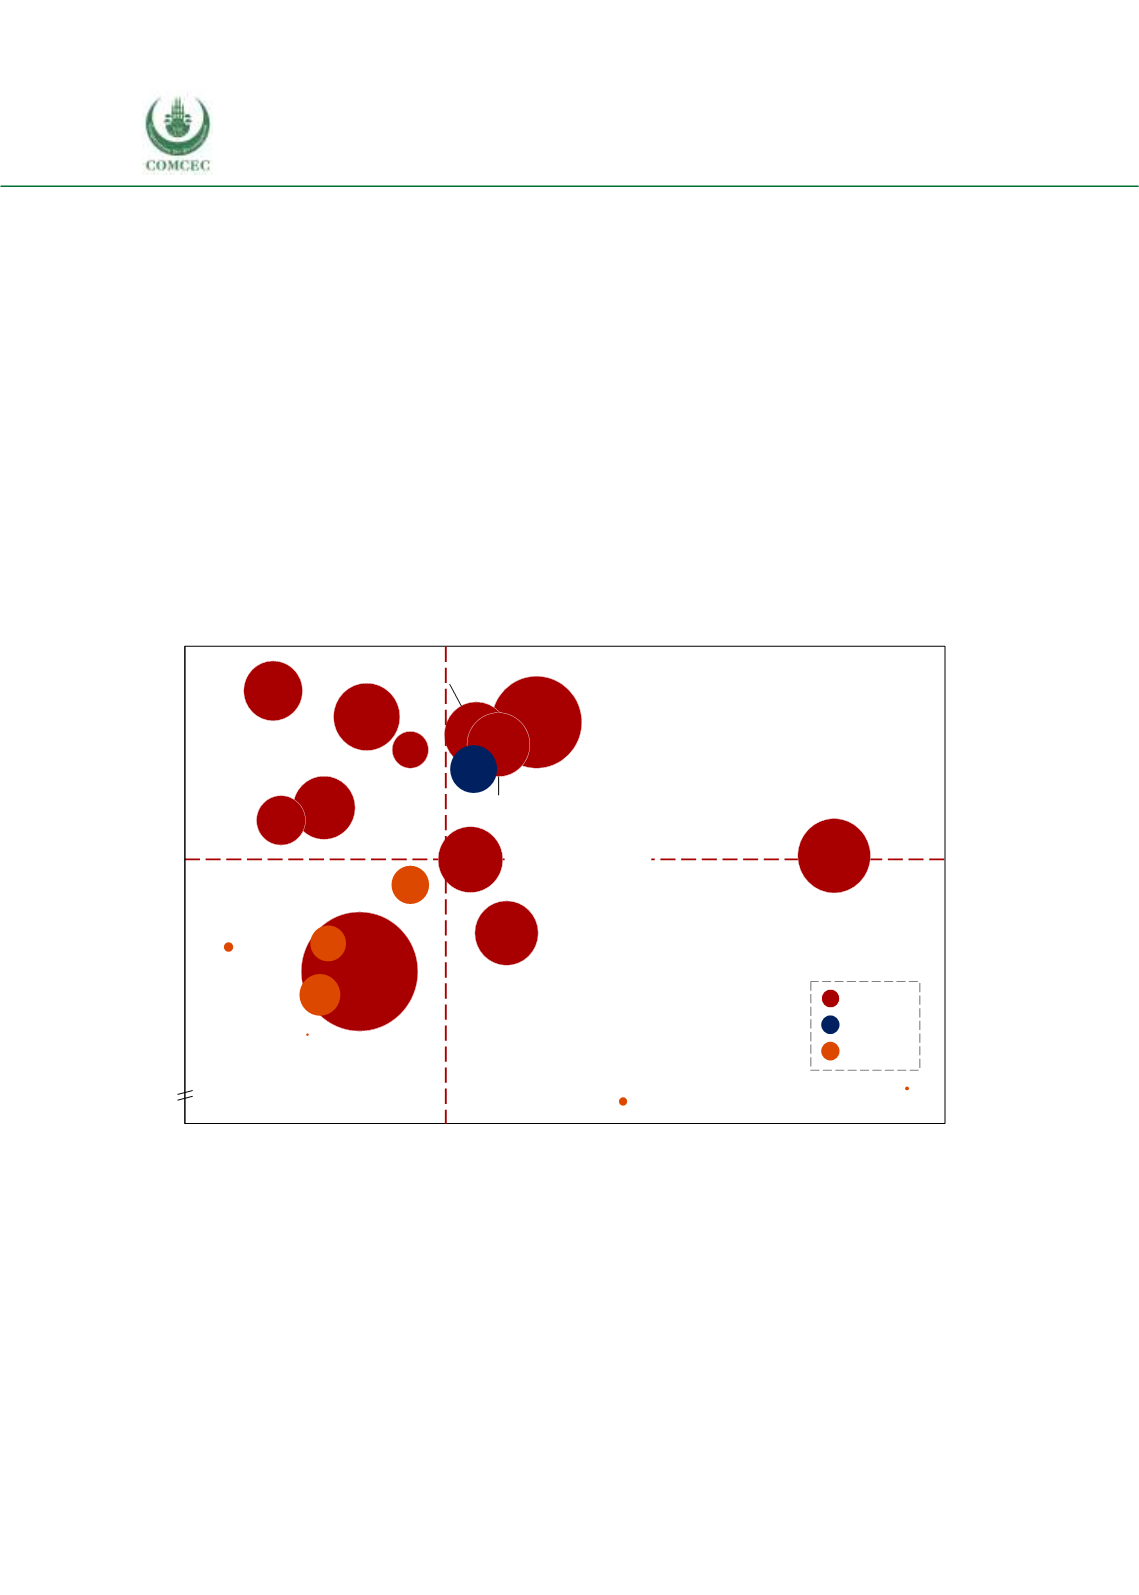
Figure 3. 13 Quadrant Scatter Graph: OIC
Source: CEPII BACI, Eurostat RAMON, UN Comtrade, UN Trade Statistics, and authors’ calculations
Note: Bubble size represents total import volume of OIC countries.
3.4. Bilateral agricultural trade flows and policy analysis
As presented in Section 3.1 above, the share of the non-OIC countries in the external trade of the
top 5 export product divisions of the OIC group countries demonstrates a slight downward
trend, particularly for the African and Arab group countries, and this points to a potential to
increase intra-group trade within country groups. Such diversion in trade is not evident for the
0
-1
40
7
15
5
8
9
20
11
60
12
35
0
65
10
25
70
30
45 50
3
55
-8
-4
1
-3
-2
10
2
4
5
6
Growth rate of the OIC region’s import, CAGR, %, 2008-2016
Cork, wood
Crude rubber
Oils, fats, waxe
Meat
Feeding stufff
for animals
Live animals
Miscellaneous p.
Dairy
Vegetables, fruit
Sugars
Coffee, tea, cocoa, spices
Fish
Share of intraregional trade in OIC countries’ agricultual imports, 2016
Oil-seeds
Cotton
Cereals
Wool
Silk
Textile bast fibres
Hides, skins
Beverages, tobacco
Agrifood
Fish
Raw