


 65 / 272

Reviewing Agricultural Trade Policies
To Promote Intra-OIC Agricultural Trade
53
Asian countries. This section aims to explore potential trade promotion possibilities across the
OIC countries as a whole (rather than within the country groups) in order to reveal possibilities
in enhancing intra-OIC trade in agricultural products.
The first part of the analysis presented in Section 3.4.1 is at the product division and regional
levels. In order to identify unexploited potential trade matches at the product level, a simple
graphical layout (quadrant scatter graph) is devised to highlight the key product divisions that
can be targeted for the promotion of intra-OIC agricultural trade. The central idea of the scatter
graph layout is to identify key product divisions to promote intra-OIC trade.
In the scatter graph, the x-axis presents the “share of intraregional trade in OIC countries’
agricultural imports” of the product (i.e., the percentage share of intra-OIC product imports in
total OIC imports of the product). The x-axis provides information on the current share of the
product in intra-OIC trade.
The y-axis provides information on the “growth rate of the OIC region’s imports” of the product
(i.e. the percentage growth rate of the OIC imports of the product). The y-axis provides a proxy
for the future growth of demand for the product. For the x-axis, the most up-to-date year, 2016,
is taken into account. For the y-axis, the growth rate is measured by Compound Annual Growth
Rate (CAGR) formula for the time period from 2008 to 2016. Moreover, the bubble sizes of each
product division represent the total import volume of the OIC member countries in 2016.
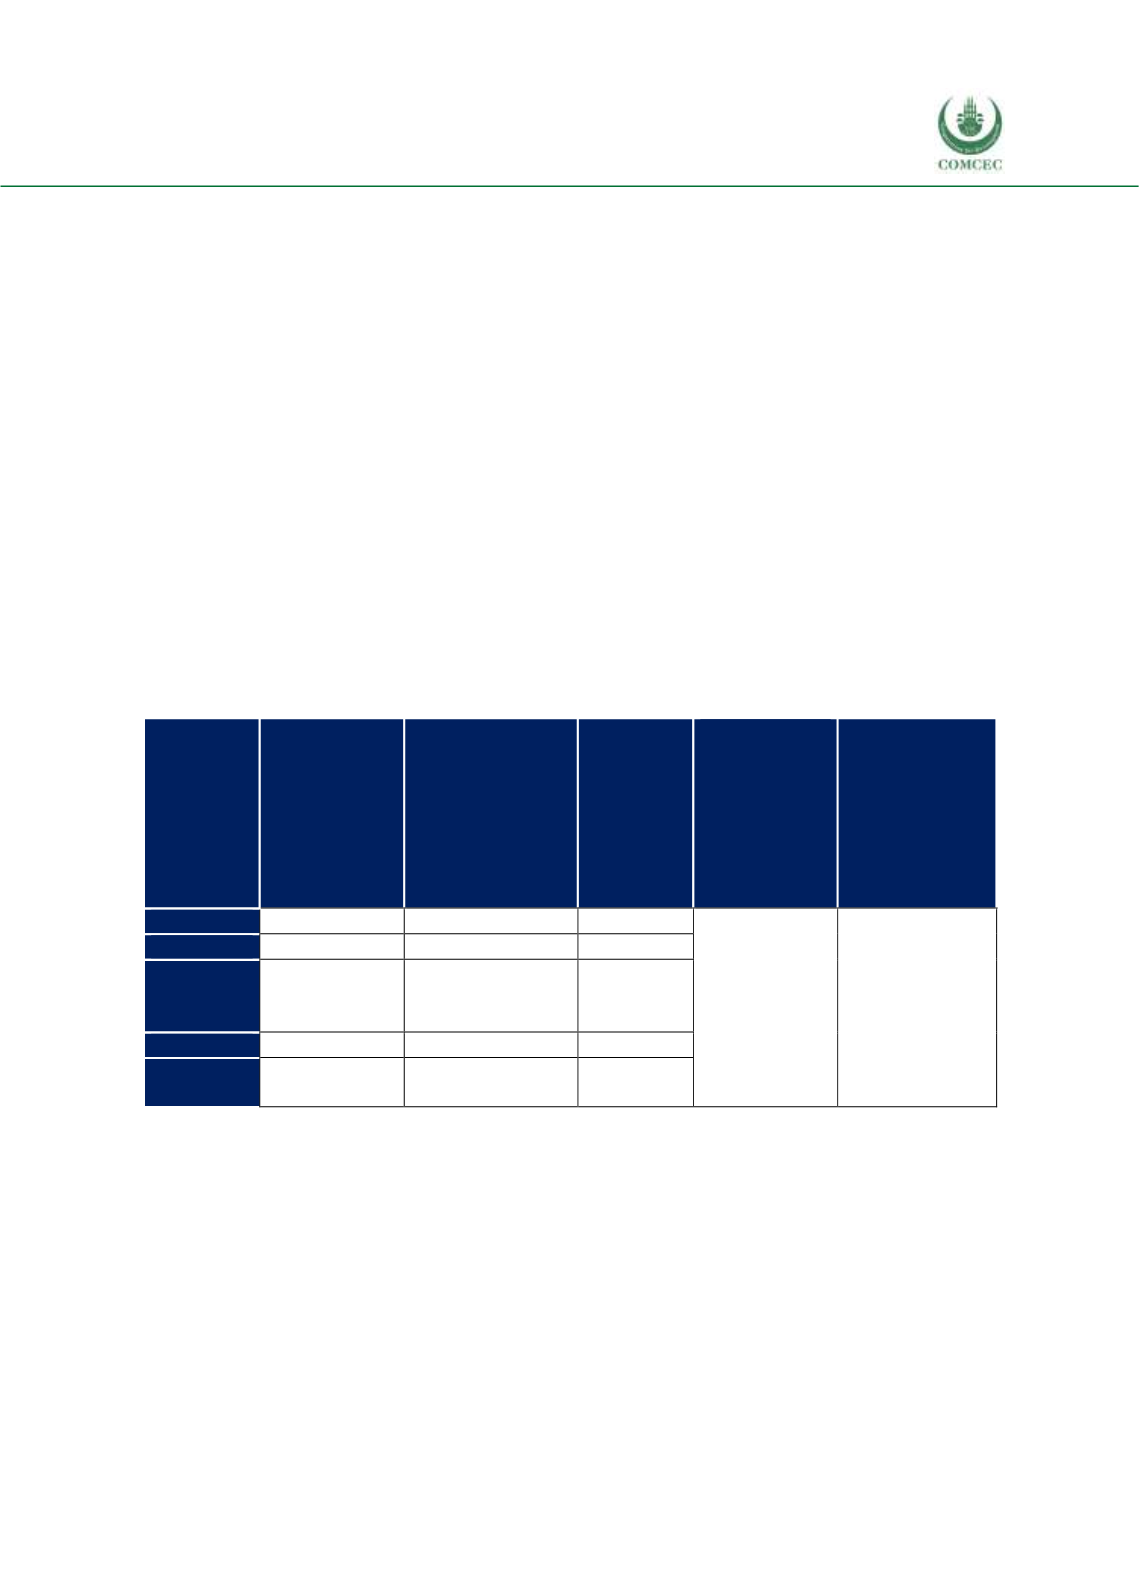
Table 3. 8 Potential Key Product Groups (Divisions) for Intra-OIC Trade Promotion
Division
% of
intraregional
trade in OIC
countries’
agricultural
imports, 2016
% growth rate of
the OIC imports,
CAGR, 2008-
2016
Total OIC
imports,
billion
USD, 2016
Threshold: %
of
intraregional
trade in OIC
countries’
total
agricultural
imports, 2016
Threshold: %
growth rate of
the OIC total
agricultural
imports, CAGR,
2008-2016
Sugars
16.7
9.3
13.7
24.2
4.3
Meat
12.8
5.9
12
Feeding
stuff for
animals
8.1
10.3
10.8
Oil-seeds
8.8
5.5
7.5
Live
animals
20.7
8.1
4.1
Source: CEPII BACI, Eurostat RAMON, UN Comtrade, UN Trade Statistics, and authors’ calculations
In this specific setup, a dashed line (i.e. a threshold) divides the x-axis. The threshold represents
the share of intra-OIC agricultural imports in total OIC agricultural imports in 2016. The product
divisions whose percentage shares in OIC imports are lower than percentage shares of overall
OIC agricultural imports are located on the left side of this threshold. In the case of the y-axis,
the threshold represents the growth rate of the OIC total agricultural imports, CAGR, 2008-2016.
The product divisions whose growth rates are higher than the OIC’s total agricultural import
basket are located on the upper side of this threshold. The key products for further analysis are
the ones with low intra-regional trade and high growth rate that are located on the upper left-
hand side of the graph (see Figure 3.13).