


 219 / 272

7
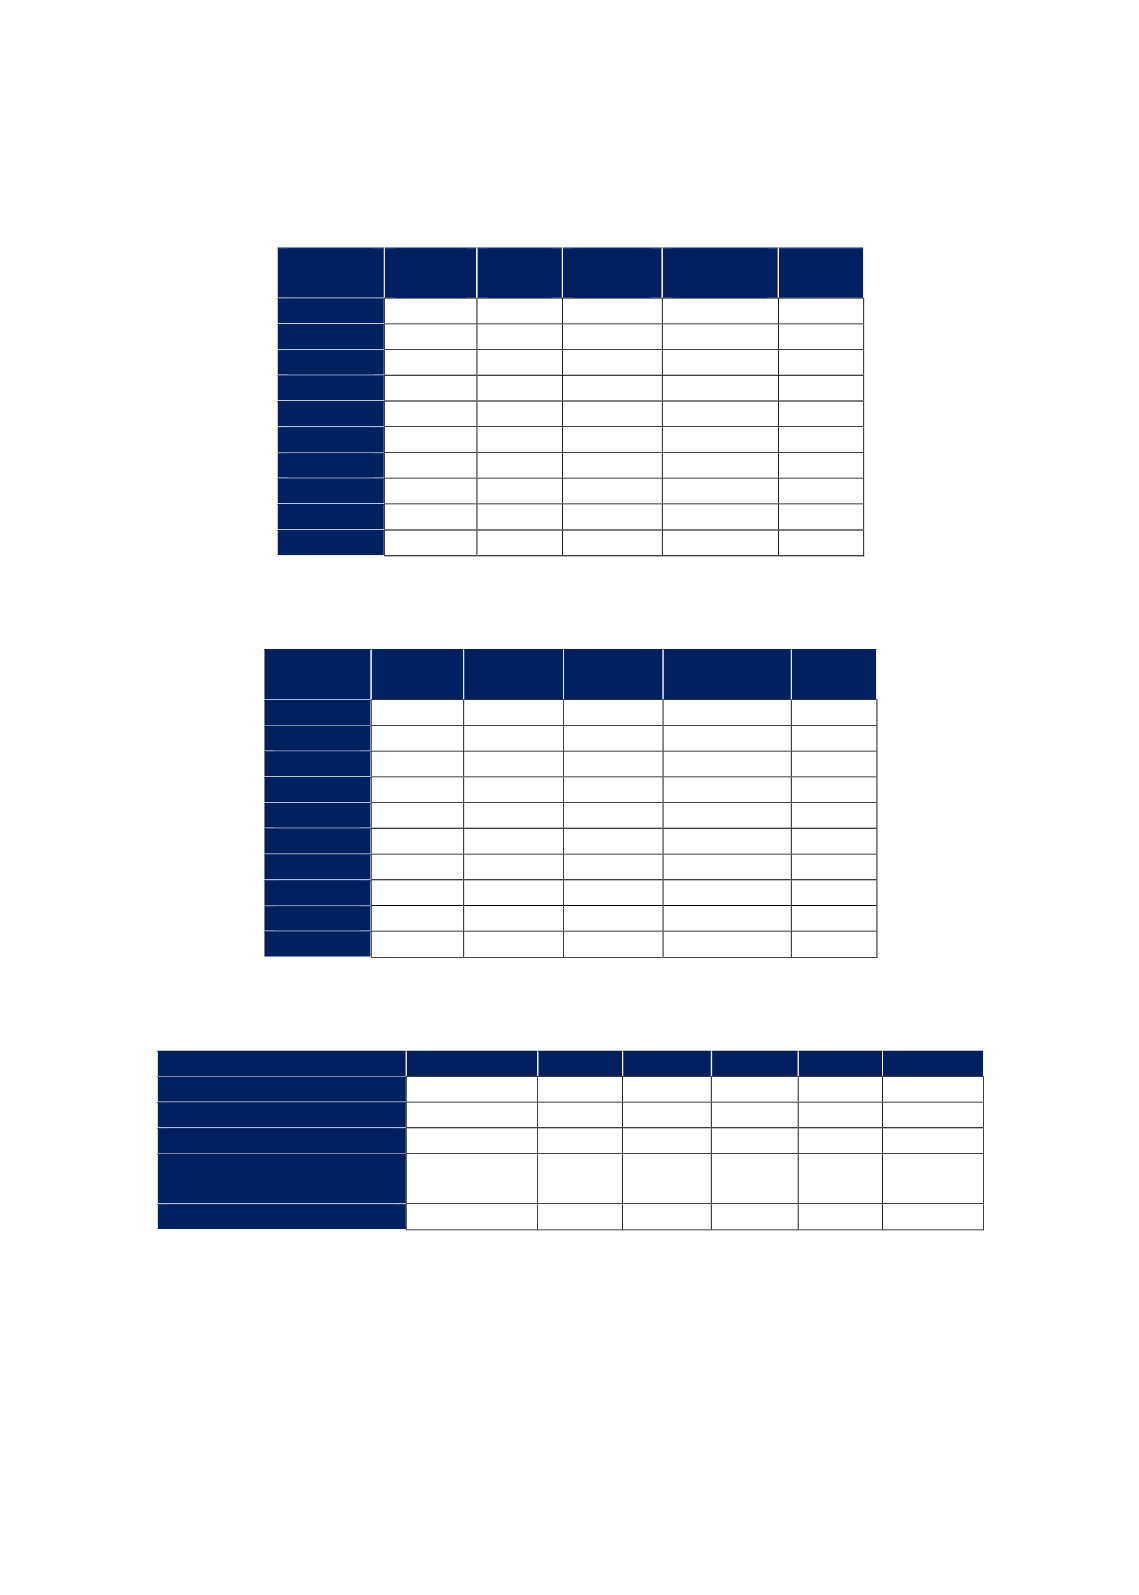
Table F. 9 % Distribution of the total export value of the top 5 export products of the Arab
Group according to destinations, top 5 in 3-year average between 2014 and 2016
African
group
Asian
group
Arab
group
Non-OIC
Countries
Total
2008
1.6
6.1
39.5
52.8
100
2009
2.5
1.8
44.5
51.2
100
2010
3.3
1.9
41.1
53.7
100
2011
2.8
13.1
32.5
51.6
100
2012
2.8
1.8
39.6
55.8
100
2013
2.4
1.7
46.2
49.7
100
2014
3.7
2.2
46.7
47.4
100
2015
3.3
1.8
49.6
45.3
100
2016
2.5
6.2
47.3
44.0
100
Average
2.8
4.1
43.0
50.2
Source: CEPII BACI, Eurostat RAMON, UN Comtrade, UN Trade Statistics
Table F. 10 % Distribution of the total import value of the top 5 import products of the Arab
Group according to country of origin, top 5 in 3-year average between 2014 and 2016
African
group
Asian
group
Arab
group
Non-OIC
Countries
Total
2008
0.1
6.7
12.9
80.3
100
2009
0.2
7.2
13.6
79.0
100
2010
0.1
8.0
11.8
80.1
100
2011
0.1
10.2
8.1
81.5
100
2012
0.2
8.0
9.7
82.1
100
2013
0.2
8.0
12.8
79.0
100
2014
0.1
8.0
11.3
80.6
100
2015
0.1
8.1
15.4
76.4
100
2016
0.1
9.2
16.9
73.7
100
Average
0.1
8.2
12.5
79.2
Source: CEPII BACI, Eurostat RAMON, UN Comtrade, UN Trade Statistics
Table F. 11 Within block tariff rates selected divisions, applied tariff rates, ad valorem
equivalent, %, 2016
Product Division
MERCOSUR EU-28 NAFTA ASEAN
OIC
Average
Live animals
0
0
1.47
1.98
0.22
0.73
Meat
1.44
0
9.56
1.87
1.70
2.91
Sugars
14.10
0
1.94
8.03
10.99
7.01
Feeding
stuff
for
animals
0.89
0
1.21
0.33
2.33
0.95
Oil seeds
0
0
0
0.25
6.14
1.28
Source: CEPII BACI, Eurostat RAMON, UN Comtrade, UN Trade Statistics, and authors’ calculations