


 217 / 272

5
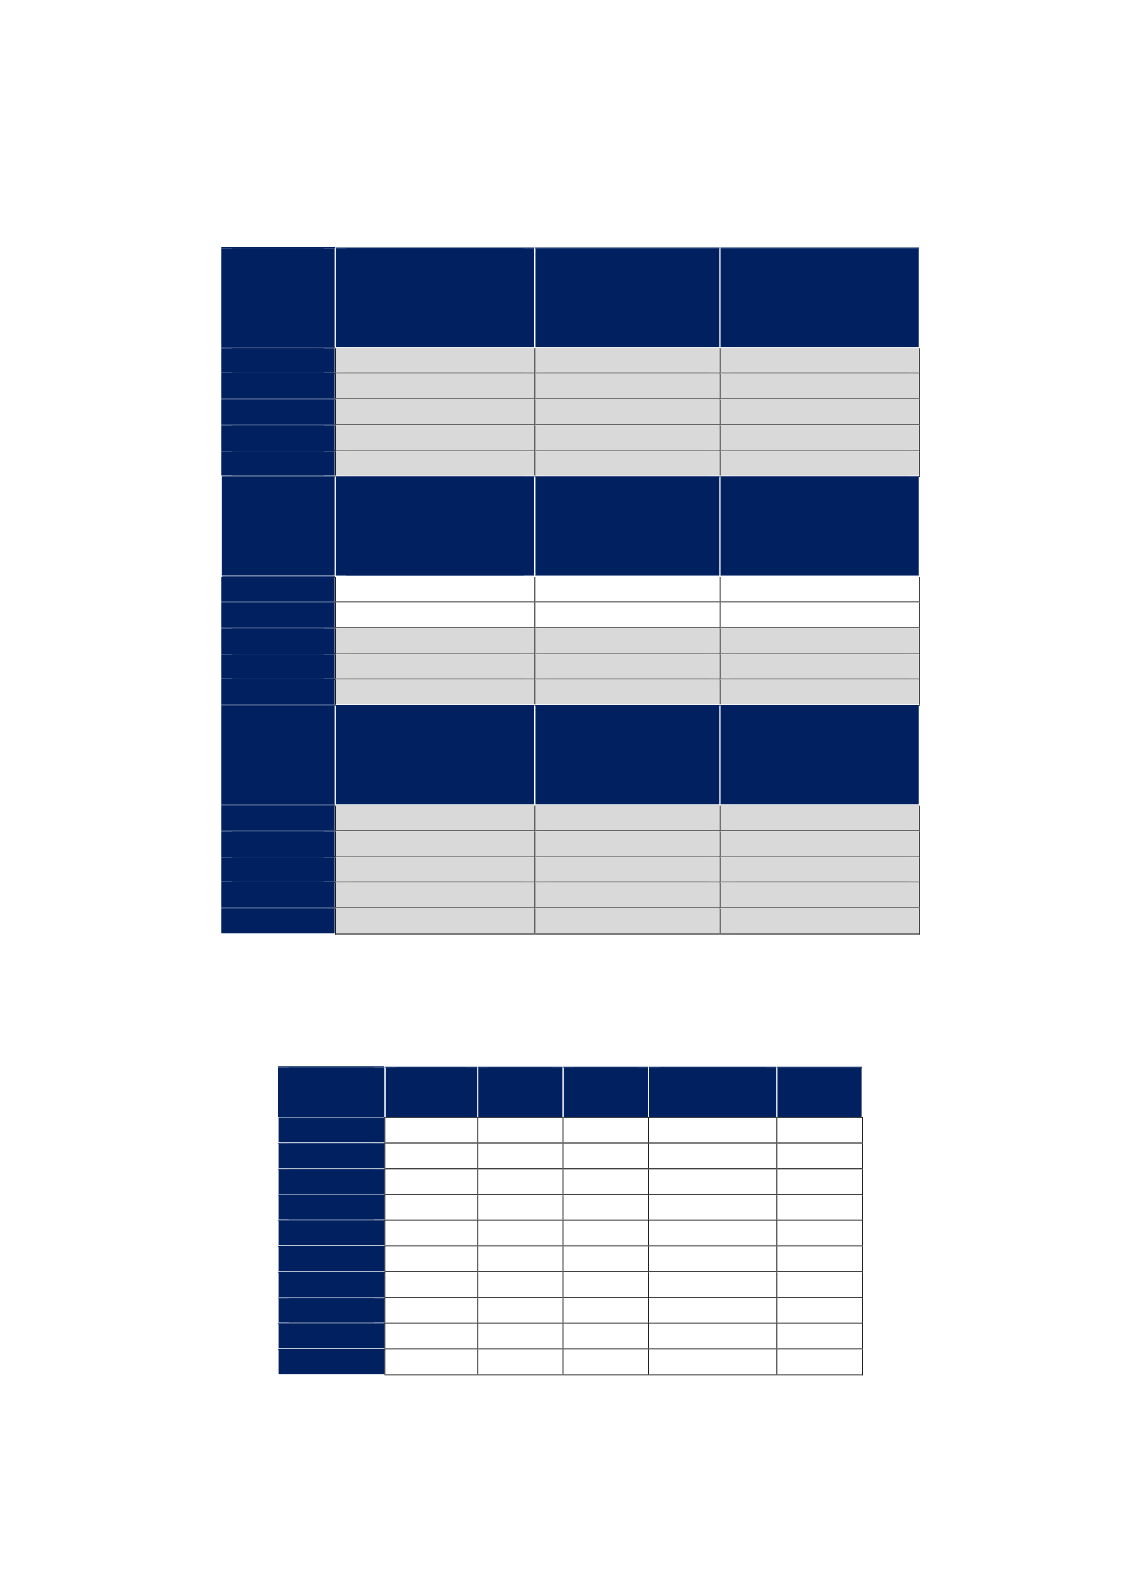
Table F. 4 Top import products according to the 2014-2016 average % share (% in the
country group; % in OIC and global trade value)
African
Group
% in African
group’s
agricultural
imports
% in OIC
agricultural
imports
Global trade value
(billion USD)
04
33.7
22.6
165.8
09
10.0
5.8
79.3
41-42-43
9.7
7.7
84.9
03
9.5
3.3
129.8
06
8.0
5.9
47.8
Asian
group
% in Asian
group’s
agricultural
imports
% in OIC
agricultural
imports
Global trade value
(billion USD)
04
17.4
22.6
165.8
05
10.8
11.5
233.4
41-42-43
9.7
7.7
84.9
08
8.0
5.3
77.3
07
6.7
5.8
103.0
Arab
group
% in Asian
group’s
agricultural
imports
% in OIC
agricultural
imports
Global trade value
(billion USD)
04
24.6
22.6
165.8
05
13.0
11.5
233.4
02
8.8
6.8
83.5
01
8.3
6.0
135.0
11-12
6.8
6.4
139.9
Source: CEPII BACI, Eurostat RAMON, UN Comtrade, UN Trade Statistics, and authors’ calculations
Note: Shaded cells denote that the % share in region’s agricultural exports is larger than the % share in
OIC agricultural exports.
Table F. 5 % Distribution of the total export value of the top 5 export products of the African
Group according to destinations, top 5 in 3-year average between 2014 and 2016
African
group
Asian
group
Arab
group
Non-OIC
Countries
Total
2008
2.3
3.9
3.3
90.5
100
2009
1.6
3.4
2.5
92.5
100
2010
1.9
5.8
2.3
90.1
100
2011
2.2
6.7
2.1
89.0
100
2012
1.9
5.7
2.7
89.7
100
2013
2.5
7.3
3.2
87.0
100
2014
2.0
8.3
2.9
86.8
100
2015
2.0
6.4
2.7
88.8
100
2016
3.0
6.3
2.9
87.8
100
Average
2.2
6.0
2.7
89.1
Source: CEPII BACI, Eurostat RAMON, UN Comtrade, UN Trade Statistics.