
8
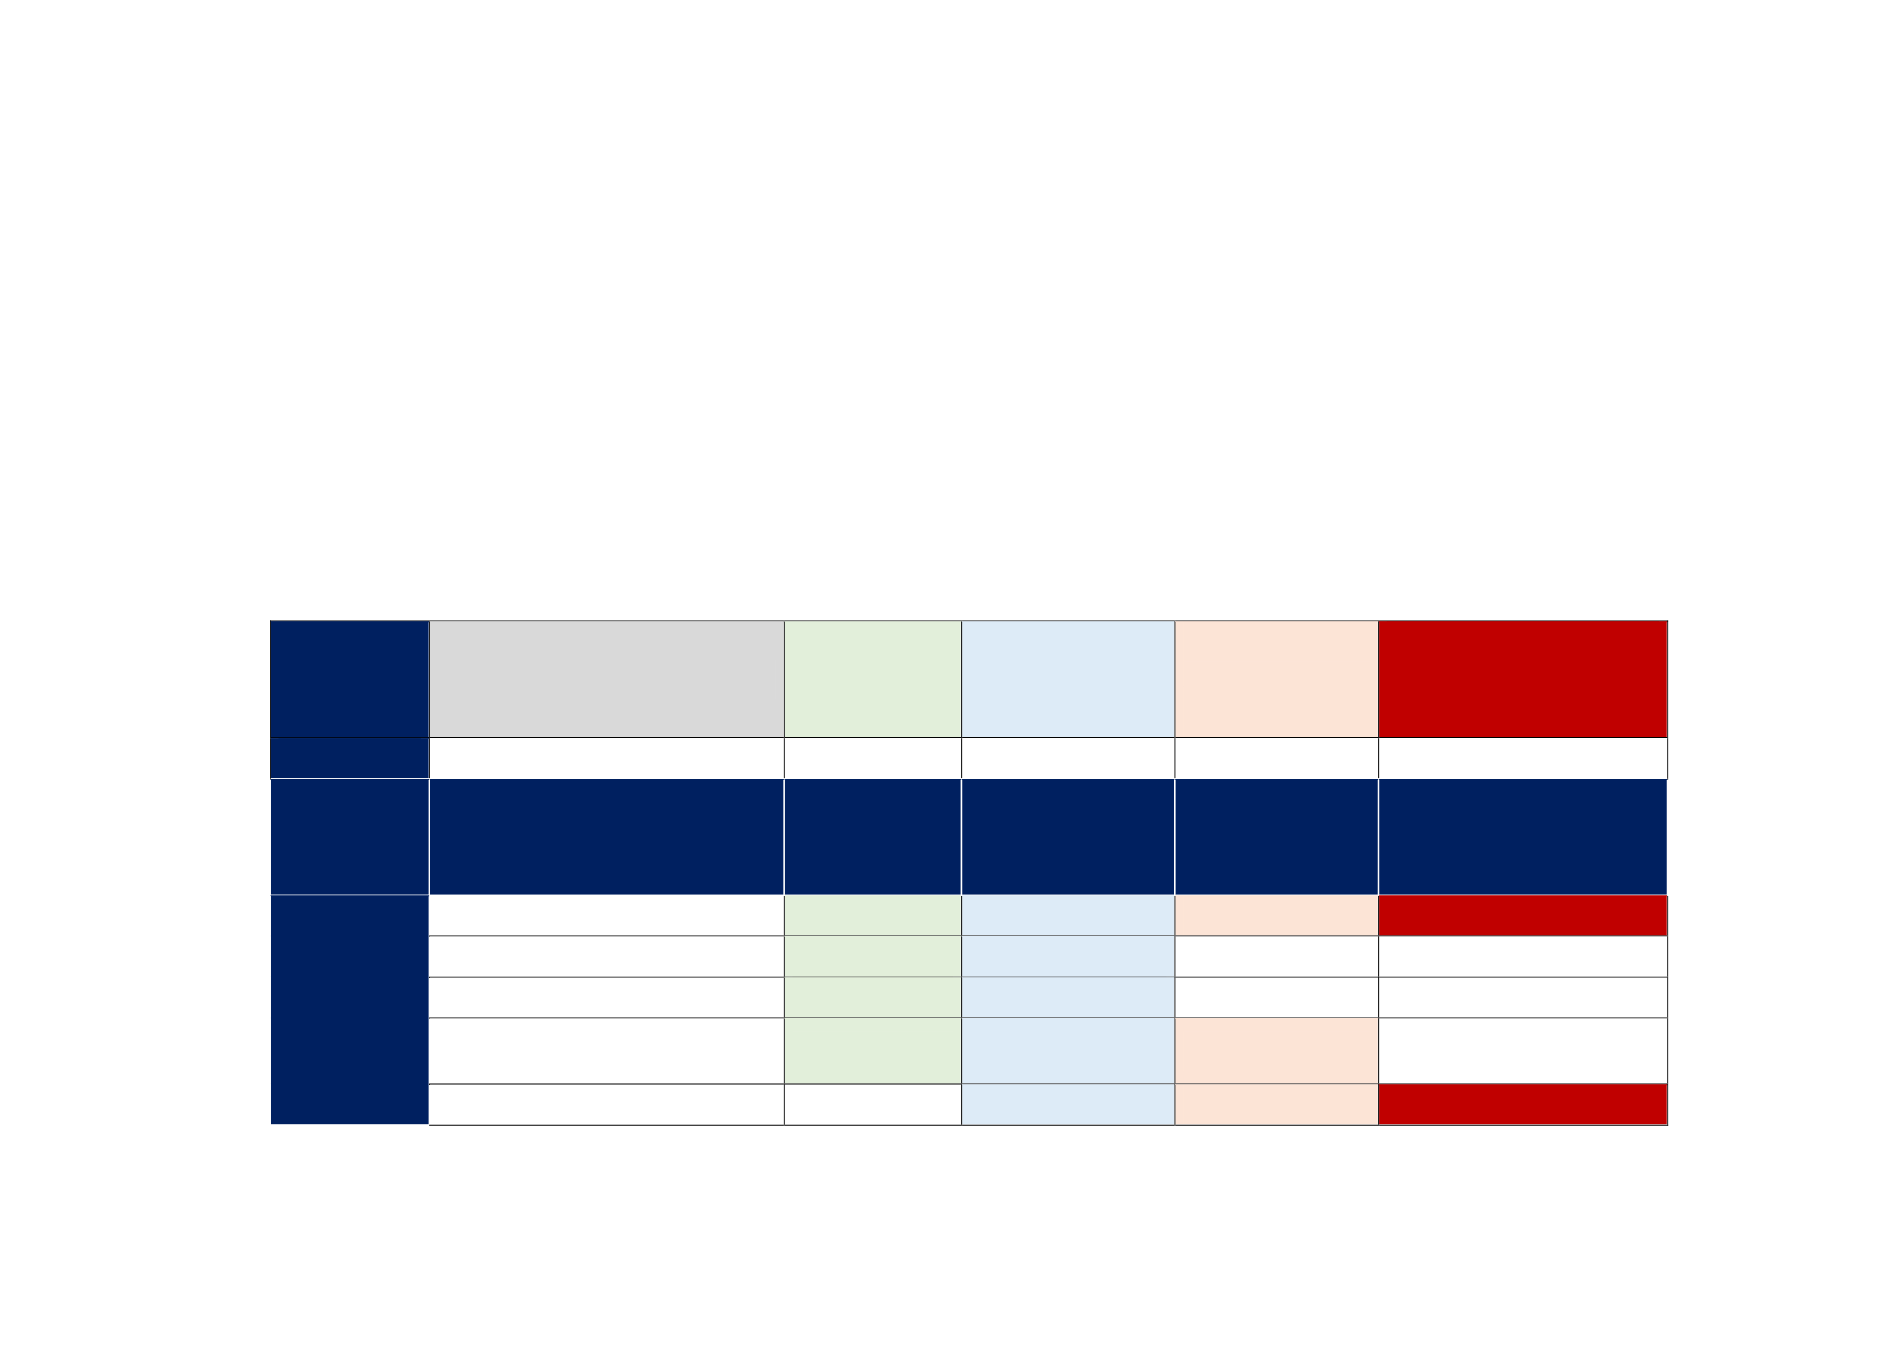
Table F.12: Top export products and tariffs implemented by the OIC members
Note: This table collects information on the global and OIC market shares of countries’ top export products at the product level and
weighted average tariff rates these products face at the OIC markets. Each column is colored according to the thresholds indicated at the
first row. To take just one example, Grapes (fresh) from Afghanistan has a large share within Afghanistan’s agricultural exports (larger
than 10%) as indicated in the colored third column. This product is important, and hence the fourth column is colored, also because 0.9%
of Afghan share in Grapes (fresh) is larger than the overall Afghan share in agricultural products. Furthermore, the share 98.7% of OIC
markets for Afghan Grapes (fresh) is larger than the overall OIC share of agricultural products from Afghanistan, and the fifth column is
also colored. Finally, the last column is colored for Grapes (fresh) because the weighted average applied tariff rates faced by this product
by Afghan exporters in OIC markets is larger than the corresponding rates applied to overall agricultural exports from Afghanistan in OIC
markets.
Thresholds for coloring
10.0
Country's share in
the world
agricultural
exports, %
Share of OIC as
destination for the
country's agr.
exports, %
Weighted avg. tariff rates
implemented by OIC
members to the country's
agr. exports, %
Exporter
Product
Share of the
product in the
exporter’s total
agr. exports, %
Share of the
country in the total
world export of the
product, %
Share of OIC as
destination for the
country's export
of the product, %
Weighted average tariff
rates implemented by OIC
members to the country's
export of the product, %
Afghanistan
Grapes, fresh
14.4
0.9
98.7
20.0
Grapes, dried
13.7
4.1
9.2
2.5
Figs, fresh/dried
12.3
11.9
1.1
2.5
Cotton (other than linters), not
carded/combed
11.5
0.5
99.6
3.0
Apples, fresh
5.6
0.4
91.3
20.0


