


 214 / 272

Annex E: Additional Material for Chapter 2
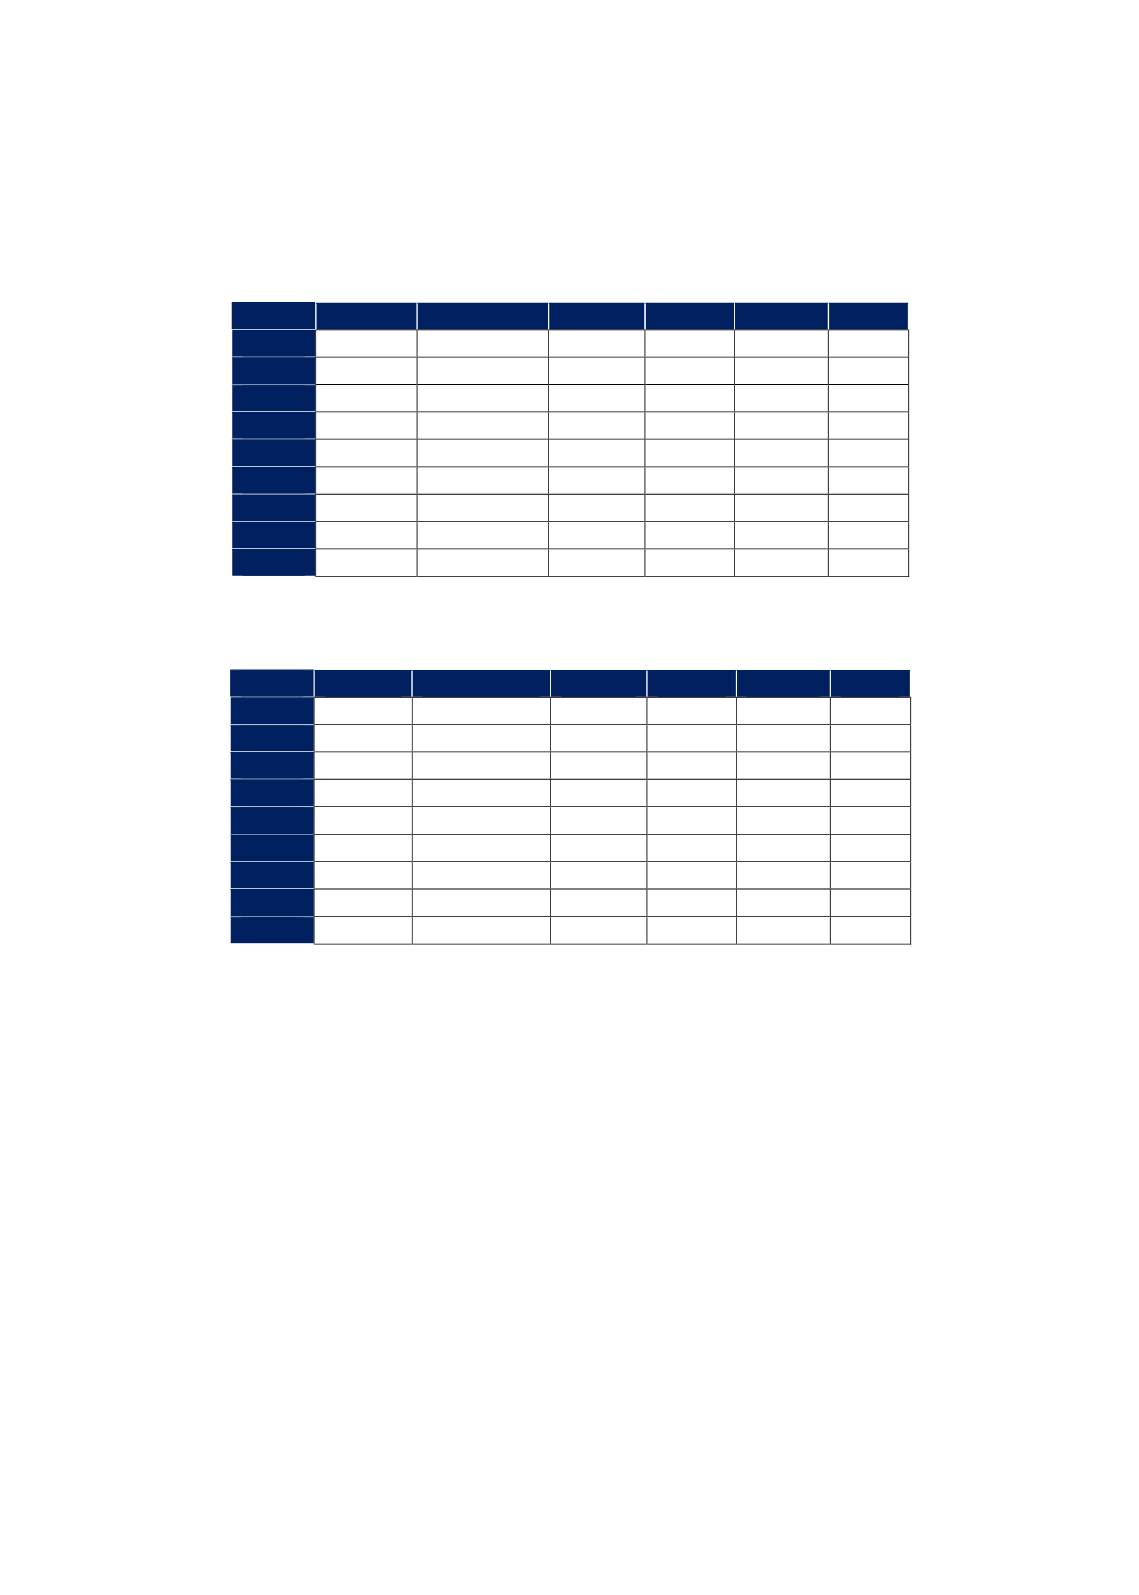
Table E. 1 Evolution of the global total export value of the top 5 agricultural export products
according to destinations (%)
NAFTA
MERCOSUR ASEAN
EU-28
Others
Total
2008
17.0
6.5
6.2
42.6
27.6
100
2009
15.6
5.8
6.7
41.9
30.0
100
2010
15.9
6.2
7.0
40.5
30.4
100
2011
16.1
6.5
7.0
39.6
30.8
100
2012
15.6
7.0
6.9
38.6
32.0
100
2013
15.4
6.6
6.6
39.6
31.9
100
2014
16.1
5.7
7.0
38.7
32.5
100
2015
16.6
5.7
7.2
37.1
33.3
100
2016
16.2
5.7
7.1
37.5
33.5
100
Source: CEPII BACI, Eurostat RAMON, UN Comtrade, UN Trade Statistics
Table E. 2 Evolution of the global total import value of the top 5 agricultural import products
according to country group of origin (%)
NAFTA
MERCOSUR
ASEAN
EU-28
Others
Total
2008
14.0
1.8
3.6
44.4
36.2
100
2009
14.2
1.6
4.1
43.4
36.7
100
2010
14.4
1.7
4.8
41.0
38.2
100
2011
13.6
1.7
5.2
39.4
40.1
100
2012
14.2
1.8
5.5
37.6
41.0
100
2013
14.0
1.9
5.4
38.3
40.5
100
2014
14.6
1.7
5.8
37.9
40.0
100
2015
16.2
1.4
6.3
36.5
39.7
100
2016
16.2
1.3
7.1
36.9
38.4
100
Source: CEPII BACI, Eurostat RAMON, UN Comtrade, UN Trade Statistics