


 216 / 272

4
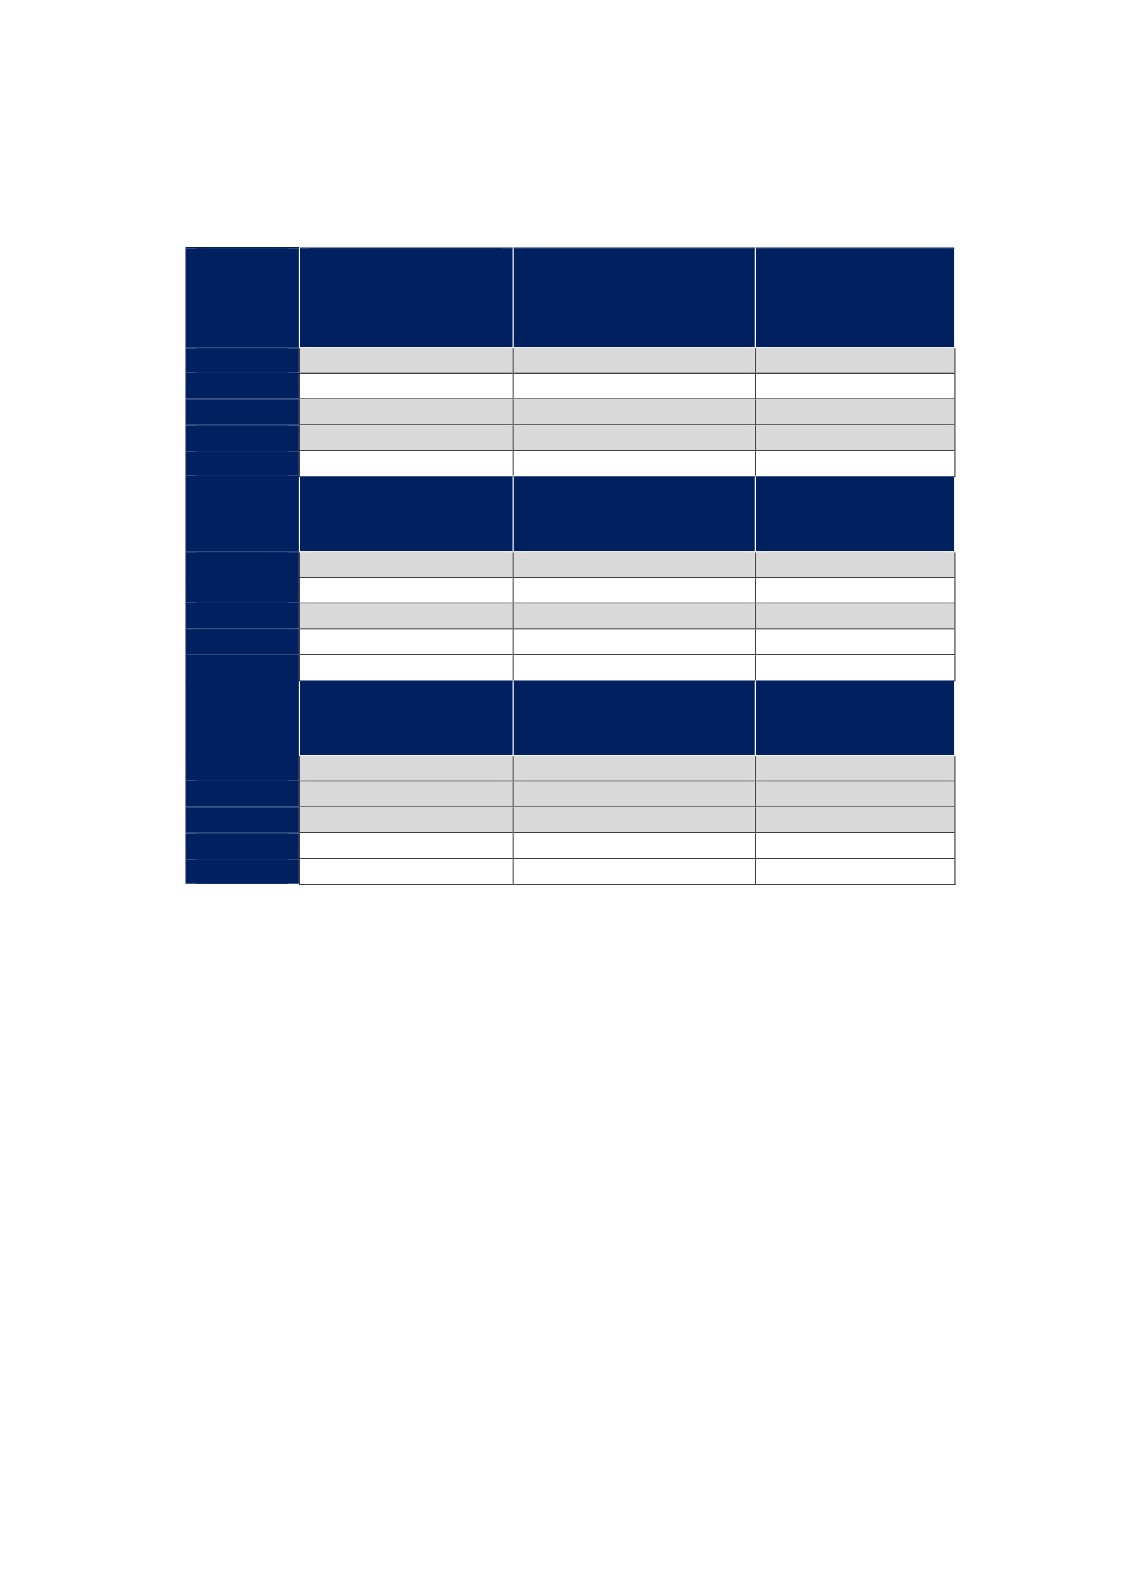
Table F. 3 Top export products according to the 2014-2016 average % share (% in the
country group; % in OIC and global trade value)
African
Group
% in African
group’s
agricultural
exports
% in OIC agricultural
exports
Global trade value
(billion USD)
07
40.5
11.2
103.0
05
13.7
17.4
233.4
24
10.1
3.8
66.6
263
7.8
2.0
13.1
03
5.4
8.3
129.8
Asian
group
% in Asian group’s
agricultural
exports
% in OIC agricultural
exports
Global trade value
(billion USD)
41-42-43
34.0
24.2
84.9
05
14.0
17.4
233.5
04
8.7
7.4
165.8
03
7.9
8.3
129.8
07
7.2
11.3
103.0
Arab
group
% in Arab group’s
agricultural
exports
% in OIC agricultural
exports
Global trade value
(billion USD)
05
31.1
17.4
233.4
03
11.7
8.3
129.8
02
9.4
2.9
83.5
41-42-43
7.4
24.2
84.9
04
6.9
7.4
165.8
Source: CEPII BACI, Eurostat RAMON, UN Comtrade, UN Trade Statistics, and authors’ calculations
Note: Shaded cells denote that the % share in region’s agricultural exports is larger than the % share in OIC
agricultural exports.