


 83 / 152

Analysis of Agri-Food Trade Structures
To Promote Agri-Food Trade Networks
In the Islamic Countries
66
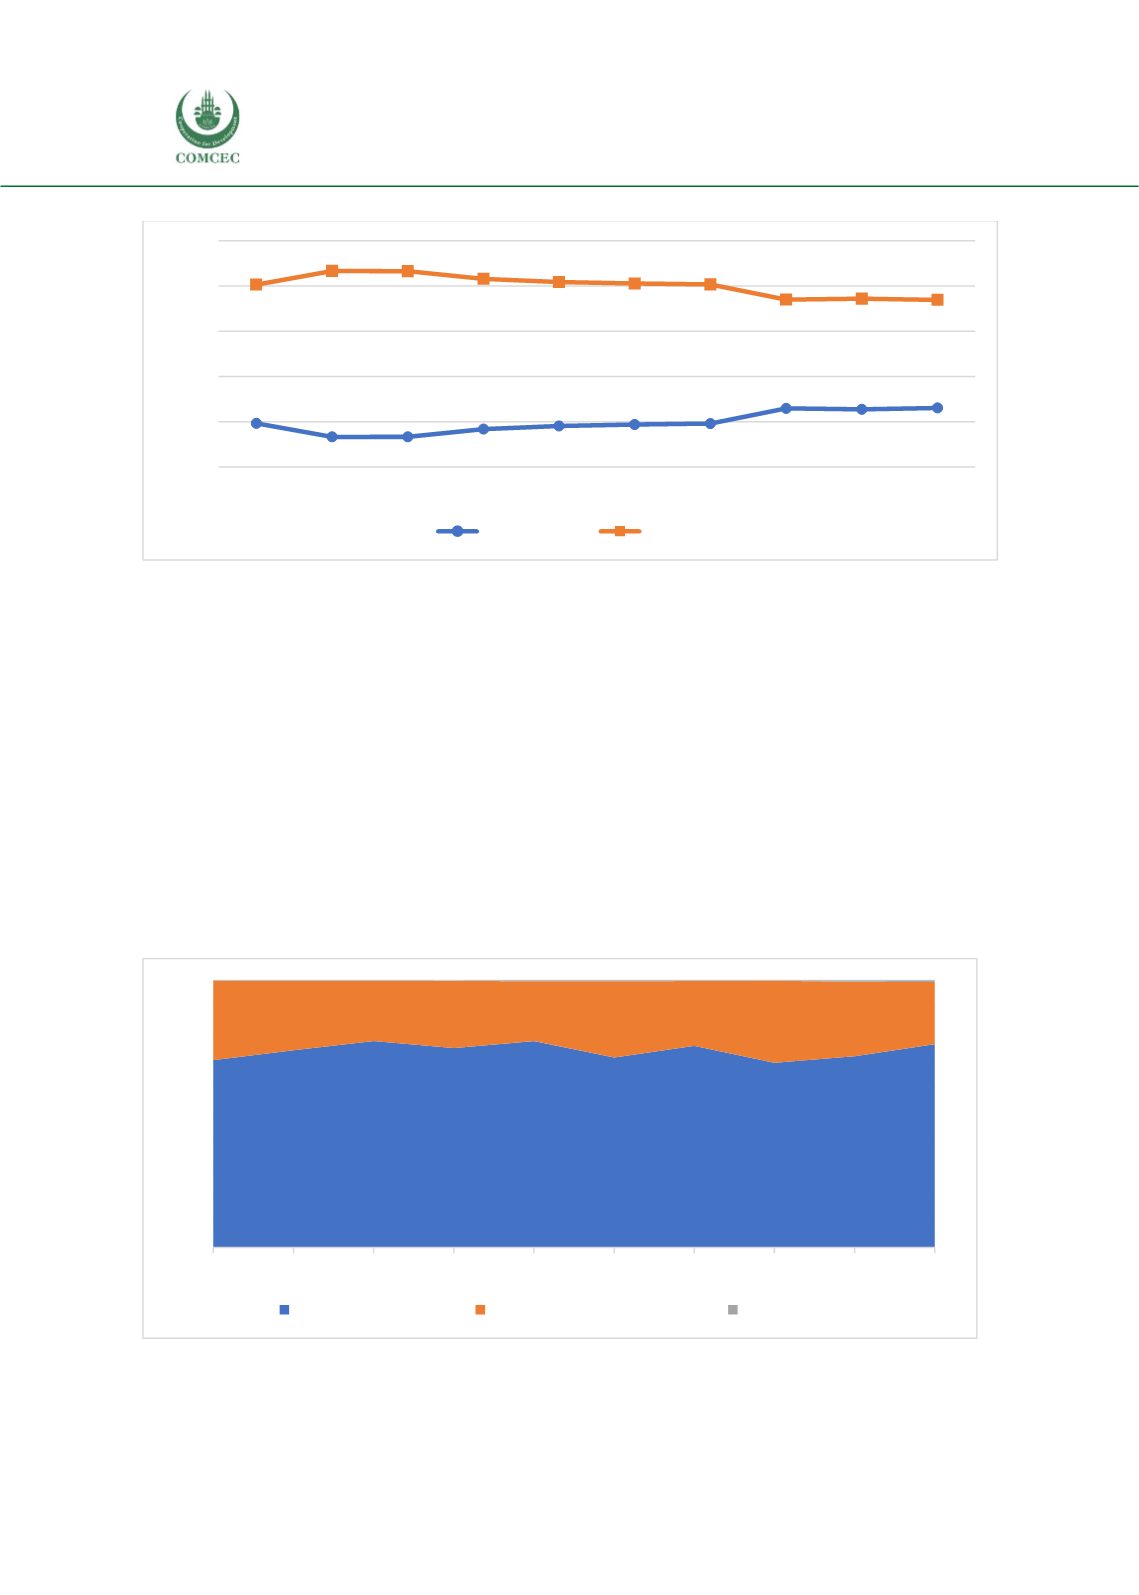
Figure 32: Trend of Bangladesh’s Agricultural Export Destinations: OIC vs. Non-OIC Members
Source: UN Comtrade retrieved through WITS
Import of Agricultural Products
Composition and patterns of Agricultural Imports
Agricultural imports by Bangladesh grew by more than four times from around 2.5 billion USD
in 2005 to more than 10 billion USD in 2015. The share of agricultural imports in the country’s
total imports slightly increased during this period. Imports of agri-food products represent the
major share of Bangladesh’s imports of agricultural products, followed by agricultural raw
materials imports. While the share of agri-food imports in total agricultural imports of
Bangladesh increased from 70% in 2005 to more than 75 % in 2015, the share of Agricultural
raw materials imports reduced from 30% in 2005 to 23 % in 2015. Imports of Fish products
increased from only 2.6 million USD in 2005 to 55.4 million USD in 2015; which however,
represent only 0.5% of total agricultural imports
(Figure 33).
Figure 33: Composition and Evolution of Import of Agricultural Products, 2005-2015, Percent
Source: UN Comtrade retrieved through WITS.
0%
20%
40%
60%
80%
100%
2005 2006 2007 2008 2009 2010 2011 2012 2013 2015
OIC member
Non-OIC
0%
10%
20%
30%
40%
50%
60%
70%
80%
90%
100%
2005 2006 2007 2008 2009 2010 2011 2012 2013 2015
Agri-Food Products
Agricultural Raw Materials
Fish Products