
Analysis of Agri-Food Trade Structures
To Promote Agri-Food Trade Networks
In the Islamic Countries
62
product group still listed at the forth position of the top 10 export items, and export of this group
is also shirked from more than 5% of total agricultural trade in 2005 to only 2.66% in 2015.
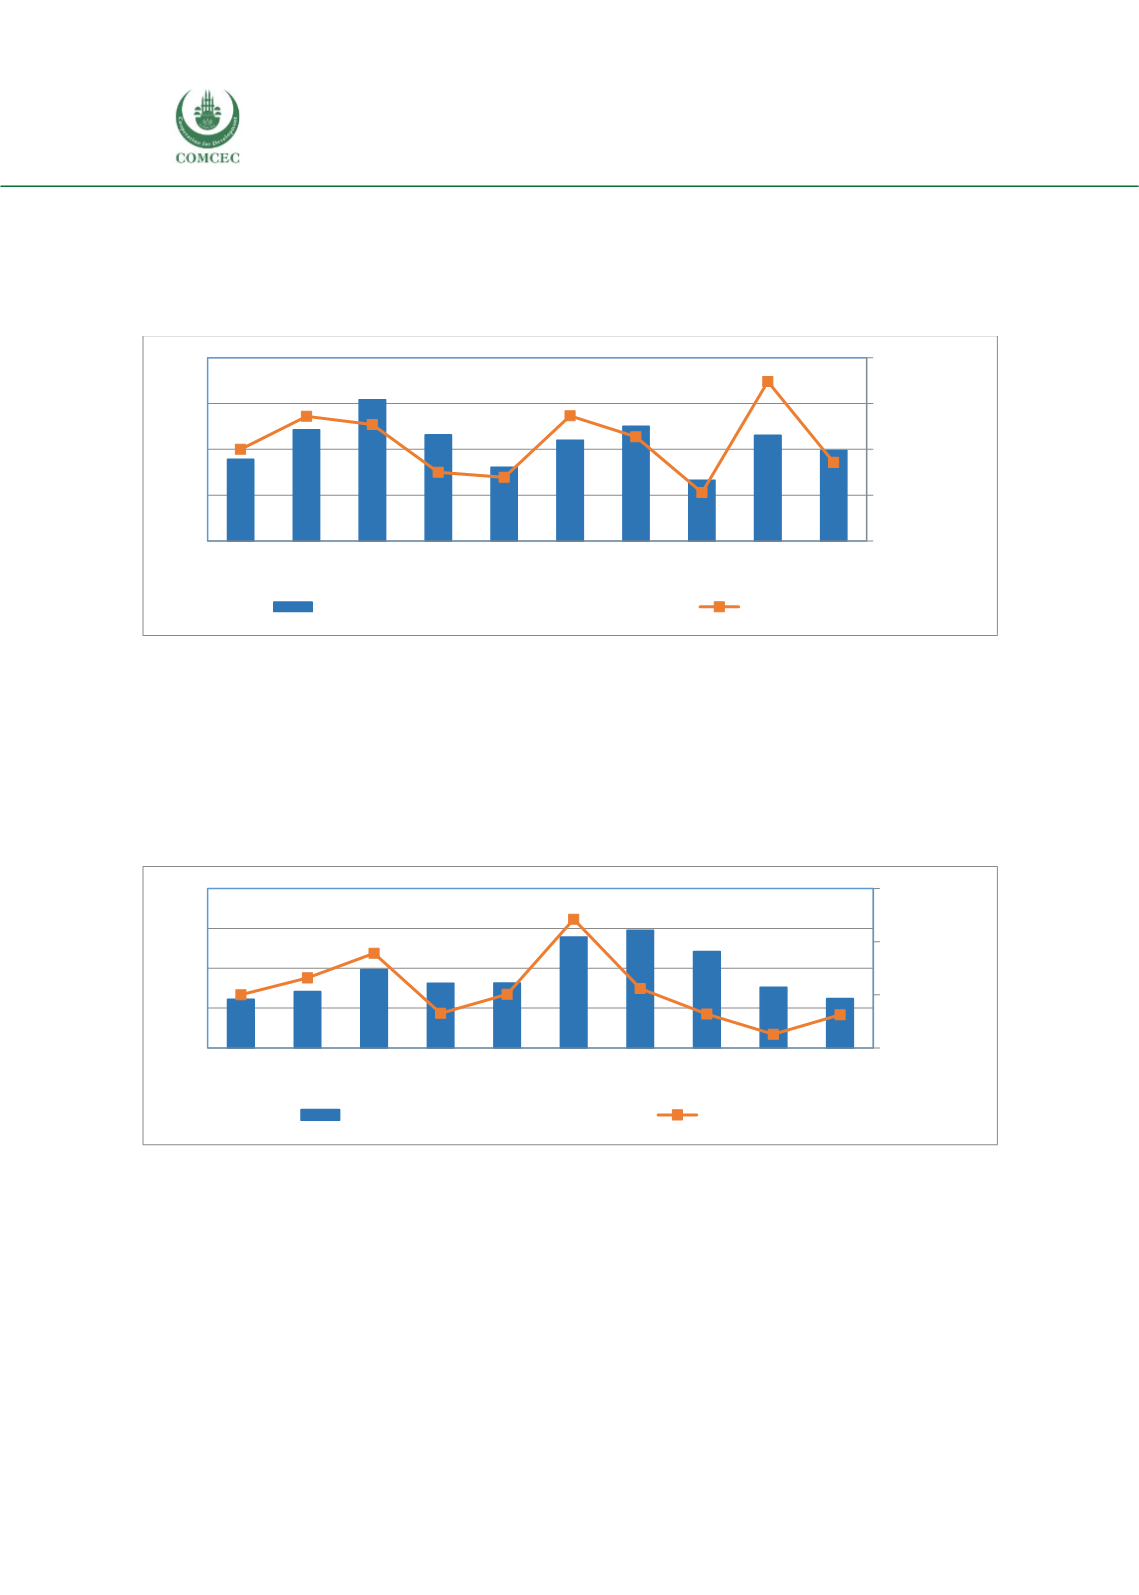
Overall, export earnings from the fishing sector have been quite unstable and growth rates
fluctuated significantly during the last decade
(Figure 30).
Figure
30:
Trend of Export of Crustaceans (Live or Dead), Chilled or Frozen: 2005-2015, Million USD
Source: UN Comtrade retrieved through WITS.
The second top Agricultural export item is Jute and other textile based fibers. Bangladesh’s
export earnings from Agricultural Raw Materials mainly come from the export of Jute products
and yarn waste. The export earnings from Jute products and yarn waste remain almost stagnant,
122 million USD in 2005 and 123 million USD in 2015; at the same time, the share of Jute
products and yarn waste in total Agricultural export earnings of Agricultural Raw Materials
reduced from approximately 17% in 2005 to around 12% in 2015
(Figure 31).
Figure 31: Trend of Export of Jute Products and Yarn Waste: 2005-2015, Million USD
Source: UN Comtrade retrieved through WITS.
Bangladesh’s agri-food exports are mainly driven by vegetable and fruit items, as almost half of
the export earnings of this sector come from vegetable and fruit exports. Vegetables, fresh,
chilled or frozen and fruit and nuts (not including oil nuts) product groups together accounted
for around 10% of total agricultural exports in 2015 and listed at the third and sixth places,
respectively, in the list of the top 10 export items. The products within this group that showed
bright export potential are potatoes, tomatoes, pointed gourd, and beans, all of which have
registered increasing volumes of exports. On the other hand, trends in exports of okra, eggplant,
cabbage, cauliflowers, and citrus fruits have exhibited a high degree of instability.
-100%
-50%
0%
50%
100%
0
200
400
600
800
2005 2006 2007 2008 2009 2010 2011 2012 2013 2015
Growth rate (%)
Crustaceans (live or dead), chilled or frozen
Growth Rate (%)
-50%
0%
50%
100%
0
100
200
300
400
2005 2006 2007 2008 2009 2010 2011 2012 2013 2015
Growth rate (%)
Jute and other textile bast fibres
Growth Rate (%)


