


 86 / 152

Analysis of Agri-Food Trade Structures
To Promote Agri-Food Trade Networks
In the Islamic Countries
69
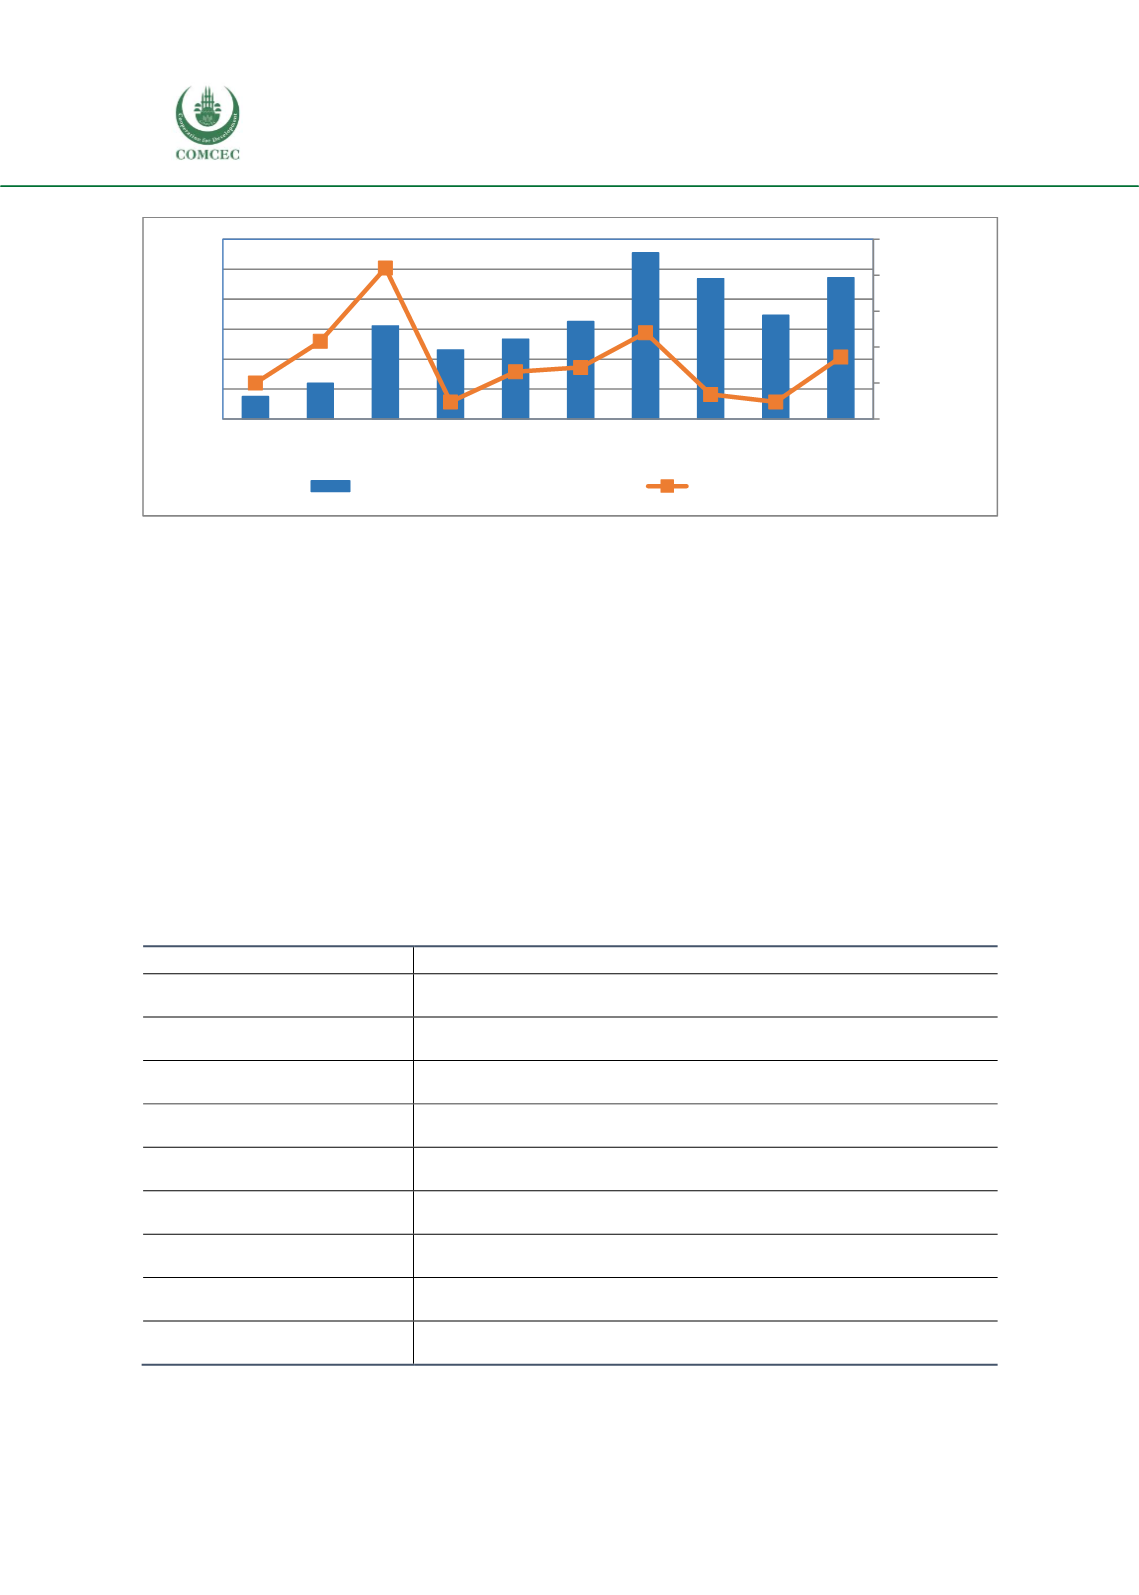
Figure 36:
Trend of Soya Bean Oil and Its Fractions Imports of Bangladesh: 2005-2015, Million USD
Source: UN Comtrade retrieved through WITS.
Bangladesh is a net importer of wheat and rice. Bangladesh imported almost 1 billion USD worth
of wheat in 2015, while the import value of rice in the same year was 400 million USD. However,
import trends of rice and wheat varied substantially during the 2005-2015 period based on
domestic production. Imports of rice decreased during normal years, but increased significantly
in years with natural disasters. Imports of wheat increased substantially over the last decade
following increased demand for wheat flour in urban areas and a decreasing trend in domestic
production and a substantial drop in food aid.
Sugar imports also showed significant and steady growth during this period following increased
demand from the growing agro-processing sector, placing it at fifth important agricultural
import item of Bangladesh. Fish and livestock and poultry production in Bangladesh flourished
over the last decades and presently meet up the majority of country’s internal demand. This has
also been reflected in the growing imports of feeding stuff for animals which is increased almost
10 times during the 2005-2015 period.
Table 18: Top 10 Agricultural Import Products and Their Top 10 Import Sources: 2005-2015
Products
Top 10 import sources
All Agricultural Products
Indonesia, India, Brazil, Argentina, Malaysia, Canada, Uzbekistan, Australia,
United States, and Thailand
Cotton [263]
India, Uzbekistan, Iran, United Sates, United Arab Emirates, Pakistan,
Turkmenistan, Australia, Singapore, and United Kingdom
Palm oil and its fractions [4222] Indonesia, Malaysia, Singapore, Thailand, Mali, Venezuela, India, South
Korea, United States, and Argentina
Soya bean oil and its fractions
[4211]
Argentina, Brazil, United States, Paraguay, Singapore, Saudi Arabia,
Indonesia, Malaysia, Vietnam, and Spain
Wheat [041]
Canada, Ukraine, Russian Federation, India, Australia, United States,
Pakistan, Argentina, Thailand, and Romania
Cane sugar, raw [06111]
Brazil, India, Thailand, Singapore, Australia, South Africa, United Kingdom,
Belize, Indonesia, and Argentina
Vegetables, fresh, chilled or
frozen [054]
Canada, Australia, India, China, Turkey, Thailand, Myanmar, Netherlands,
United States, and Ethiopia
Oil-seeds and oleaginous fruits
[22]
Canada, Argentina, United States, Australia, Uruguay, Brazil, India, Ukraine,
Russian Federation, and Indonesia
Feeding stuff for animals [08]
India, United States, Brazil, Netherlands, Singapore, Paraguay, Thailand,
Australia, China, and Croatia
-50%
0%
50%
100%
150%
200%
0
200
400
600
800
1.000
1.200
2005 2006 2007 2008 2009 2010 2011 2012 2013 2015
Growth rate (%)
Soya bean oil and its fractions
Growth Rate (%)