


 22 / 99

13
5.
AGRICULTURAL PRODUCTION AND PRODUCTIVITY
Various crops are grown in the COMCEC Member Countries because of agro-
ecological conditions. In order to compare the efficiency of agricultural production and
productivity, the production amounts and yield values were analyzed. In production
analysis, fruits, vegetables were used. On the other hand, in the yield analysis maize,
rice, cotton, and potatoes which are the most common cultivated crops in irrigated areas
were studied.
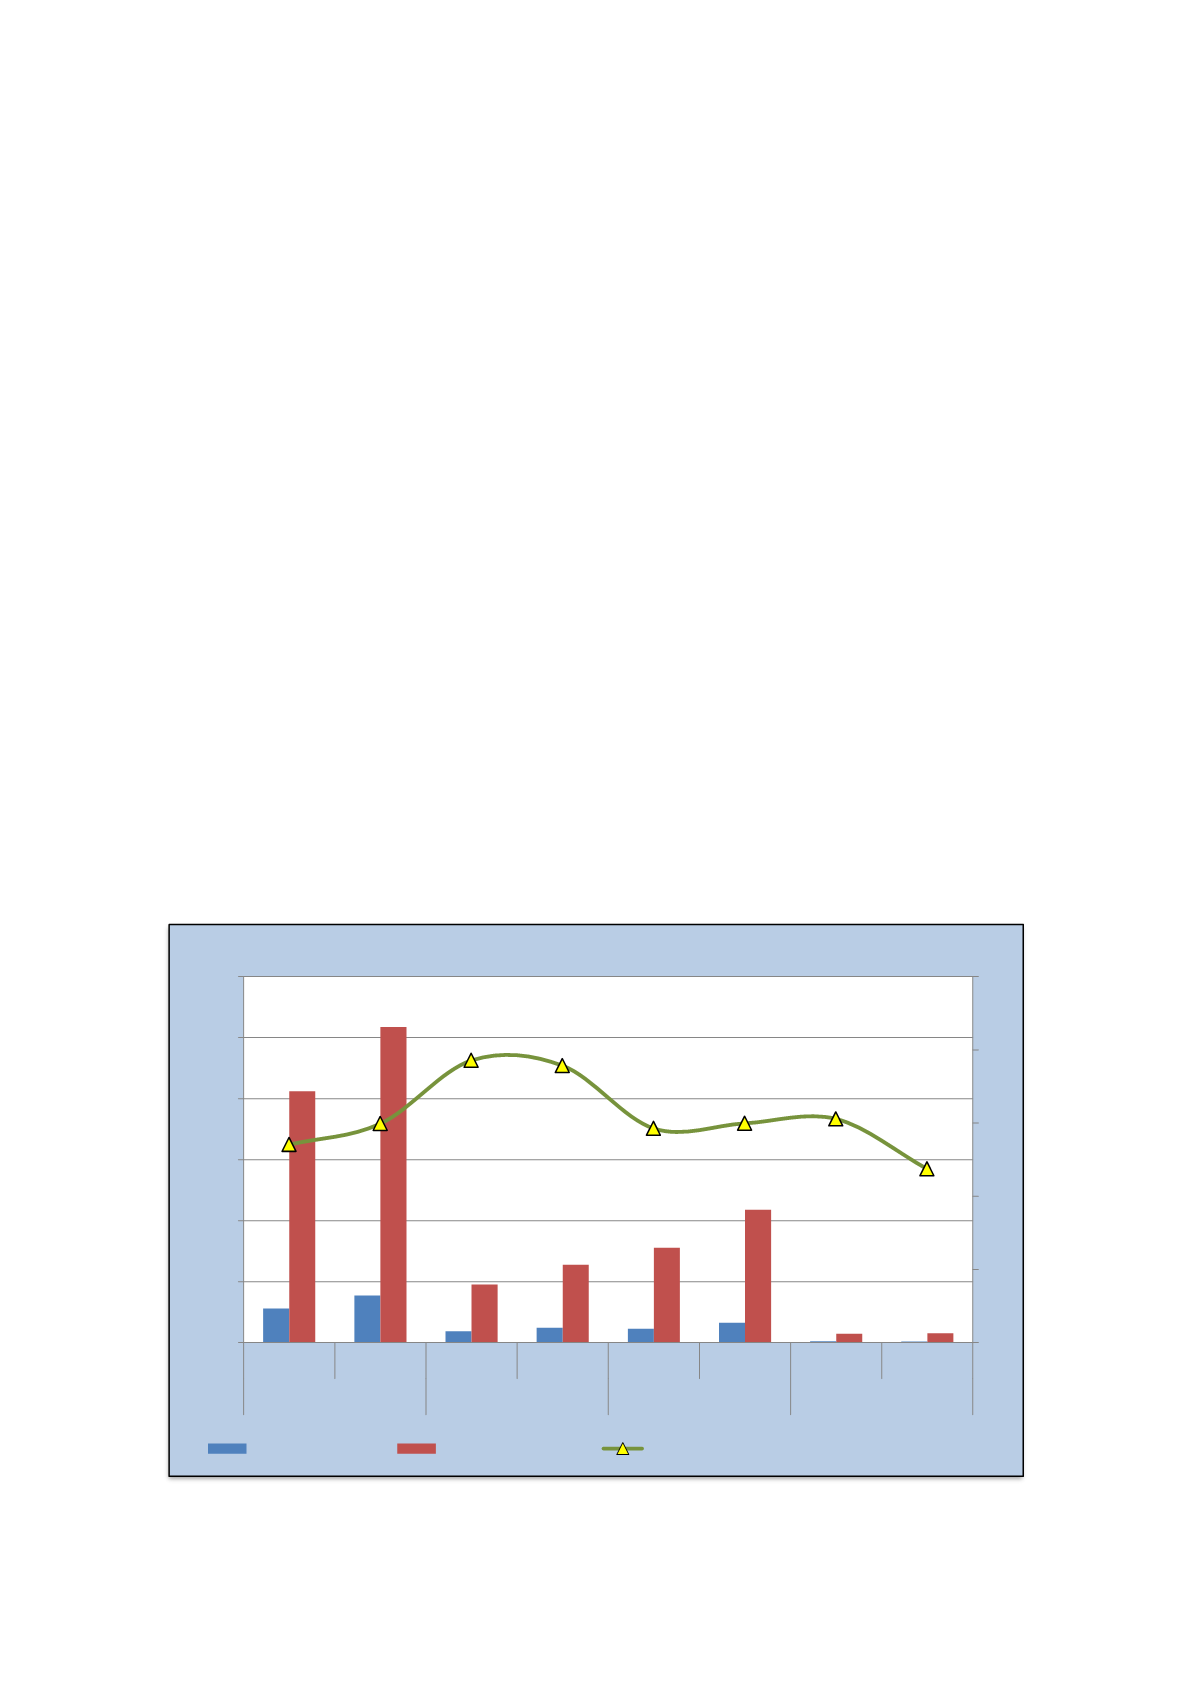
According to 2011 data, COMCEC Member Countries produced 15% of the
world total cereals production with 2.6 billion tons. In the same year, its share in the
world fruit production was 18.9% with 638 million tons. The share of the COMCEC
Member Countries in the world total production of vegetables was 15% (Figure 5.1).
Looking at country level production, it is seen that there are huge differences
among their production volume. Some countries like Indonesia, Turkey, Bangladesh,
Nigeria, Pakistan, Iran, and Egypt dominate the COMCEC Region in terms of
agricultural production in general.
Figure 5.1. Agricultural Production in the COMCEC Region
Source: COMCEC, 2013.
279
387
92
121
114
163
11
9
2,061
2,587
475
638
777
1,088
73
76
13.5%
15.0%
19.3%
18.9%
14.6%
15.0%
15.3%
11.9%
0
5
10
15
20
25
0
500
1000
1500
2000
2500
3000
2000 2011 2000 2011 2000 2011 2000 2011
Cereals
Fruit
Vegetable
Meat
%
Million Tons
OIC (left axis)
World (left axis)
OIC Share in the World Total (rigth axis)