
Risk Management in
Islamic Financial Instruments
98
Avg Equity (ROAE) are both higher for the Islamic banks (1.24% and 11.05%) compared to the
same of conventional banks (1.04% and 8.23%). But, the conventional banks have higher
dividend payout ratio. (See Chart 4.49)
Net
Interest
Margin
%
2013
Net Int
Rev / Avg
Assets
%
2013
Non Int
Exp / Avg
Assets
%
2013
Pre-Tax
Op Inc /
Avg Assets
%
2013
Return On
Avg Assets
(ROAA)
%
2013
Return On
Avg Equity
(ROAE)
%
2013
Dividend
Pay-Out
%
2013
Islamic
1.407
1.3655
0.765667
1.432833
1.415667
8.949333
0
Conventional
1.288938
1.156917
1.580448
0.617573
0.533073
5.263042 0.452708
Liquidity Ratios
Chart 4.50 shows that, on the average, Islamic banks in Tunisia maintain a better liquidity
position compared to the conventional bank. Interbank ratio of 139% of the Islamic banks
suggests that they are lenders to interbank market while the conventional are in general
borrowers, with average interbank ratio as 82.97%. For the Higher ratios of Net Loans / Cust &
ST Funding and Net Loans / Tot Dep & Bor. represent lower liquidity which is the
representative trend for the conventional banks as compared to the Islamic banks.
Interbank
Ratio
%
2013
Net Loans /
Tot Assets
%
2013
Net Loans / Dep &
ST Funding
%
2013
Net Loans / Tot
Dep & Bor
%
2013
Liquid Assets / Dep
& ST Funding
%
2013
Islamic
300.3363
30.7675
37.02433
37.00367
40.69917
Convent
ional
90.13026
32.76673
43.55769
38.42176
11.56496
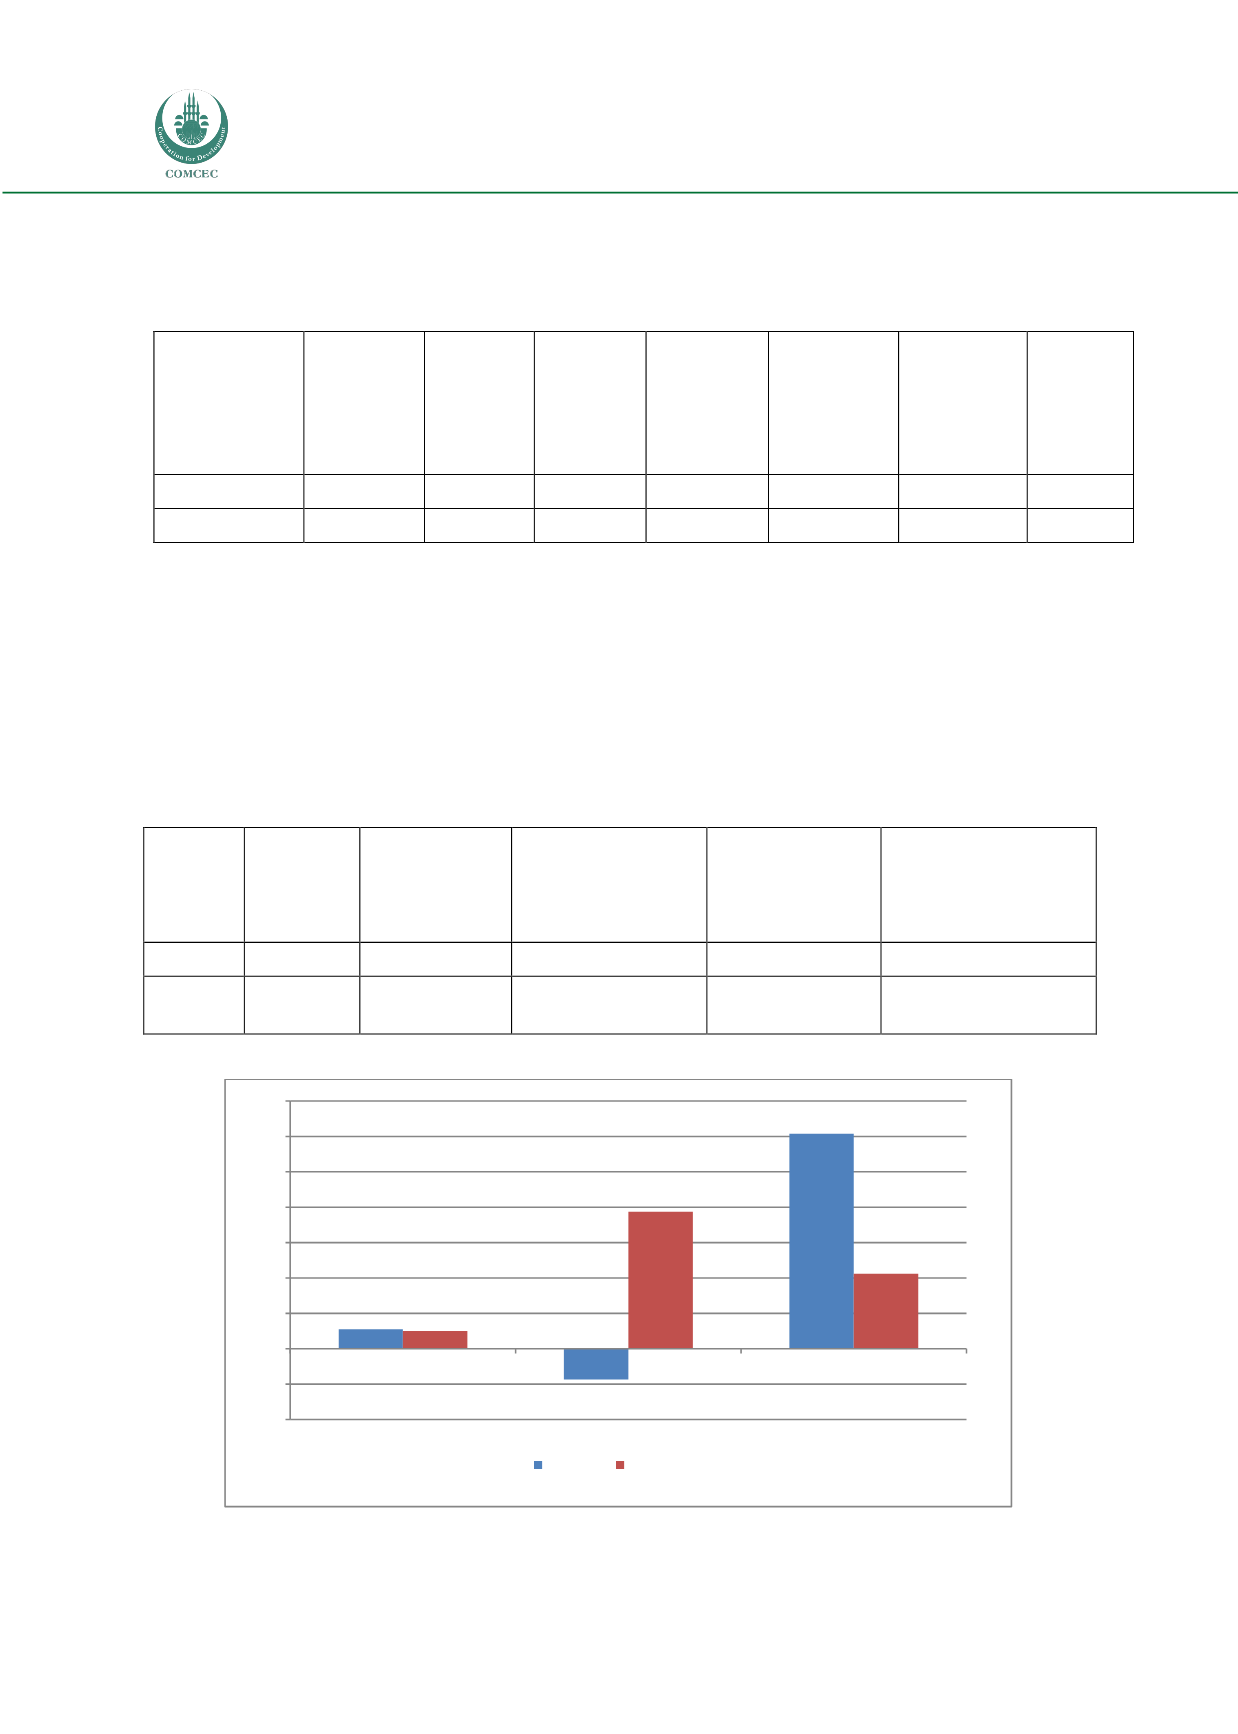
Chart 4.47: Asset Quality Ratios for Tunisian Banks
Source: BankScope Database 2013
2,73
-4,32
30,35
2,50
19,38
10,61
-10
-5
0
5
10
15
20
25
30
35
Loan Loss Res / Gross Loans
%
2013
Loan Loss Prov / Net Int Rev
%
2013
Loan Loss Res / Impaired Loans
%
2013
Islamic
Conventional


