


 33 / 64

COMCEC Poverty Outlook 2016:
Human Development in OIC
25
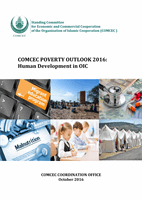
Figure 24: Annual growth rate in HDI of OIC Member States by income groups between 1990
and 2015
Source : Own calculations from UNDP (2015)
Note: The rates are calculated as the annual compound growth rate.
Although the HDI value increases with income, the association between income and HDI rank
is more ambiguous at the country level for the given income groups. The last column o
f Table 5includes the difference between HDI rank and gross national income (GNI) rank for different
income groups. This difference is -8,4 on average for OIC implying that human development
lags behind the economic prosperity in the OIC member states in general. This difference is
much smaller for low and lower-middle income countries (-2,8 and -1,3 respectively).
However, it is considerable higher for upper-middle income and high income countries. The
difference for high income group is almost -30 implying that this group was not able to
translate its wealth into human development as much as the other high income countries.
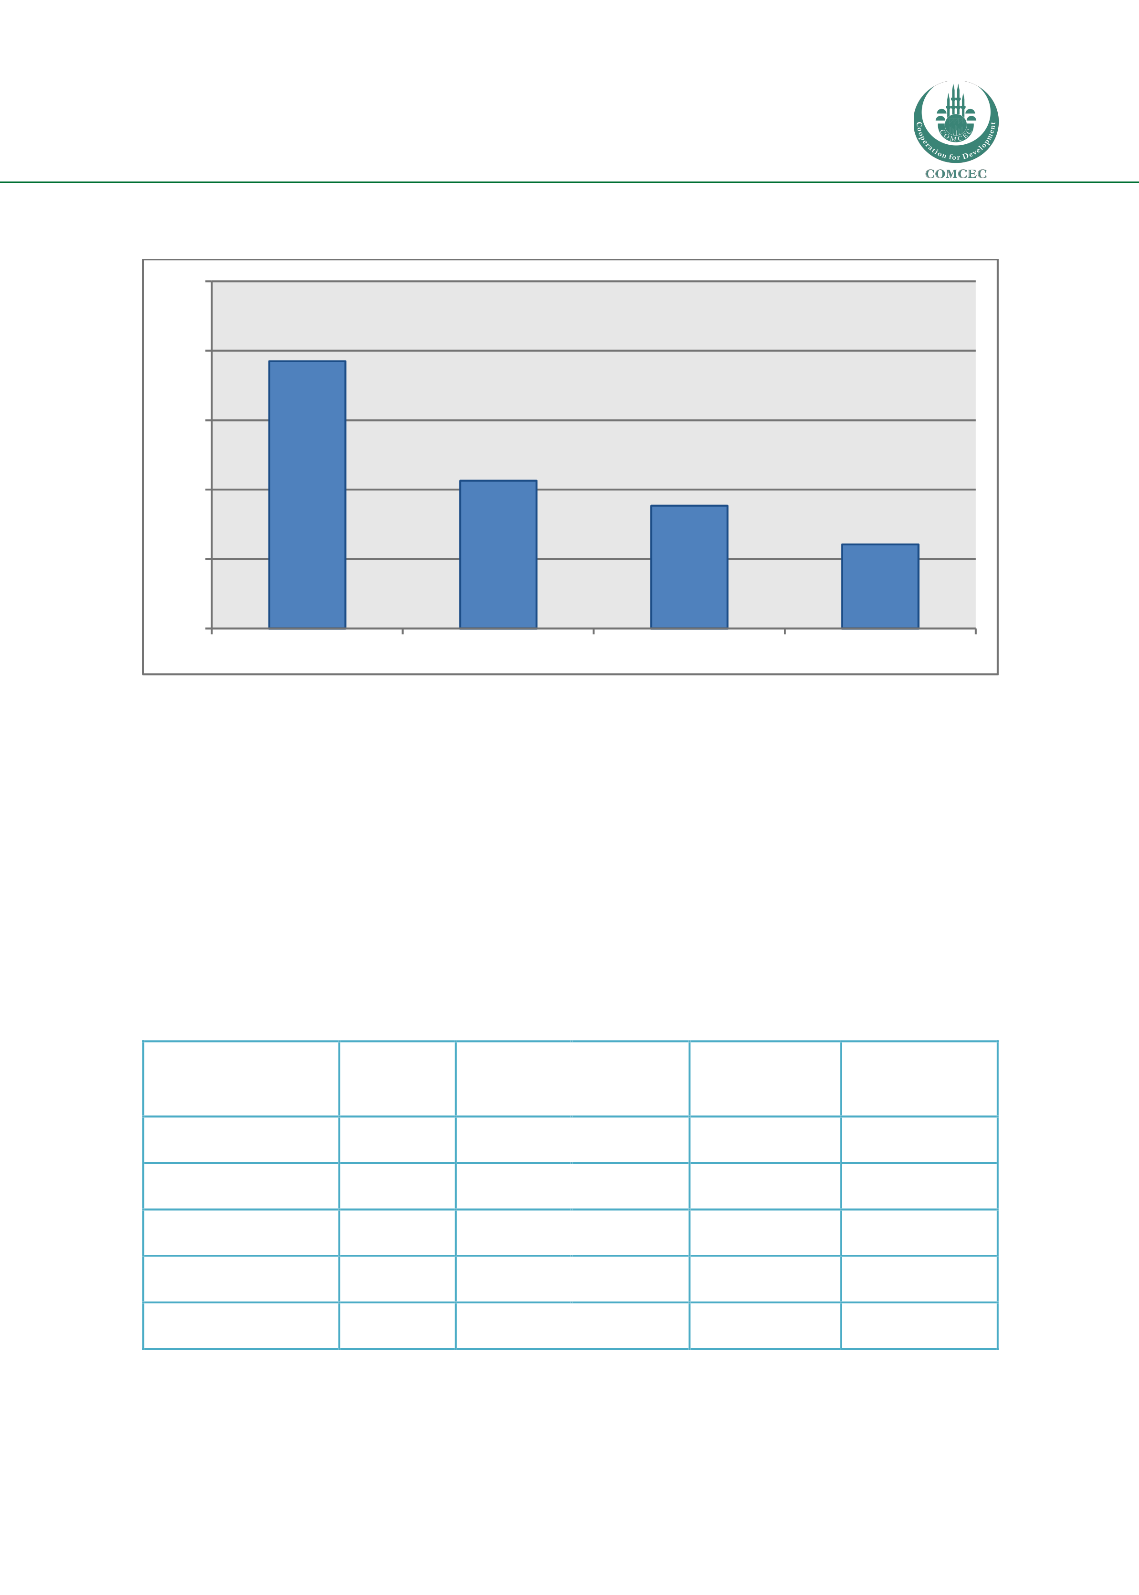
Table 5: Components of HDI by income groups, 2015
Life
expectancy
(years)
Expected
schooling
(years)
Mean
schooling
(years)
GNI (2011 PPP
$)
HDI-GNI rank
difference
OIC
67,6
11,4
6,5
15.017
-8,4
Low income
58,5
9,0
3,0
1.545
-2,8
Lower-middle income
67,6
11,0
6,7
6.285
-1,3
Upper-middle income
72,3
12,9
8,5
14.866
-12,4
High income
76,6
14,4
8,7
66.686
-29,6
Source: Own calculations from UNDP (2015).
Note: The averages are unweighted. That is, each country in the groups has the same weight irrespective of its
population.
1,54
0,85
0,71
0,49
0,00
0,40
0,80
1,20
1,60
2,00
Low income
Lower-middle income Upper-midle income
High income