


 36 / 64

COMCEC Poverty Outlook 2016:
Human Development in OIC
28
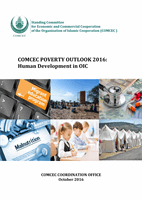
since the HDI methodology changed in 2010 significantly. Therefore, the HDI scores in 2009
and 2015 are not fully comparable.
Table 9: OIC Member States by human development level, 2009 and 2015
2009
2015
# of
Countries
%
# of
Countries
%
Low Human Development
14
25
23
41
Medium Human Development
28
51
13
23
High Human Development
9
16
14
25
Very High Human Development
4
7
6
11
Total
55
100
56
100
Source: Own calculations from corresponding years’ HDR.
Note: The methodology of HDI has evolved over time. Therefore, the HDI values and hence categories are not
fully comparable over time.
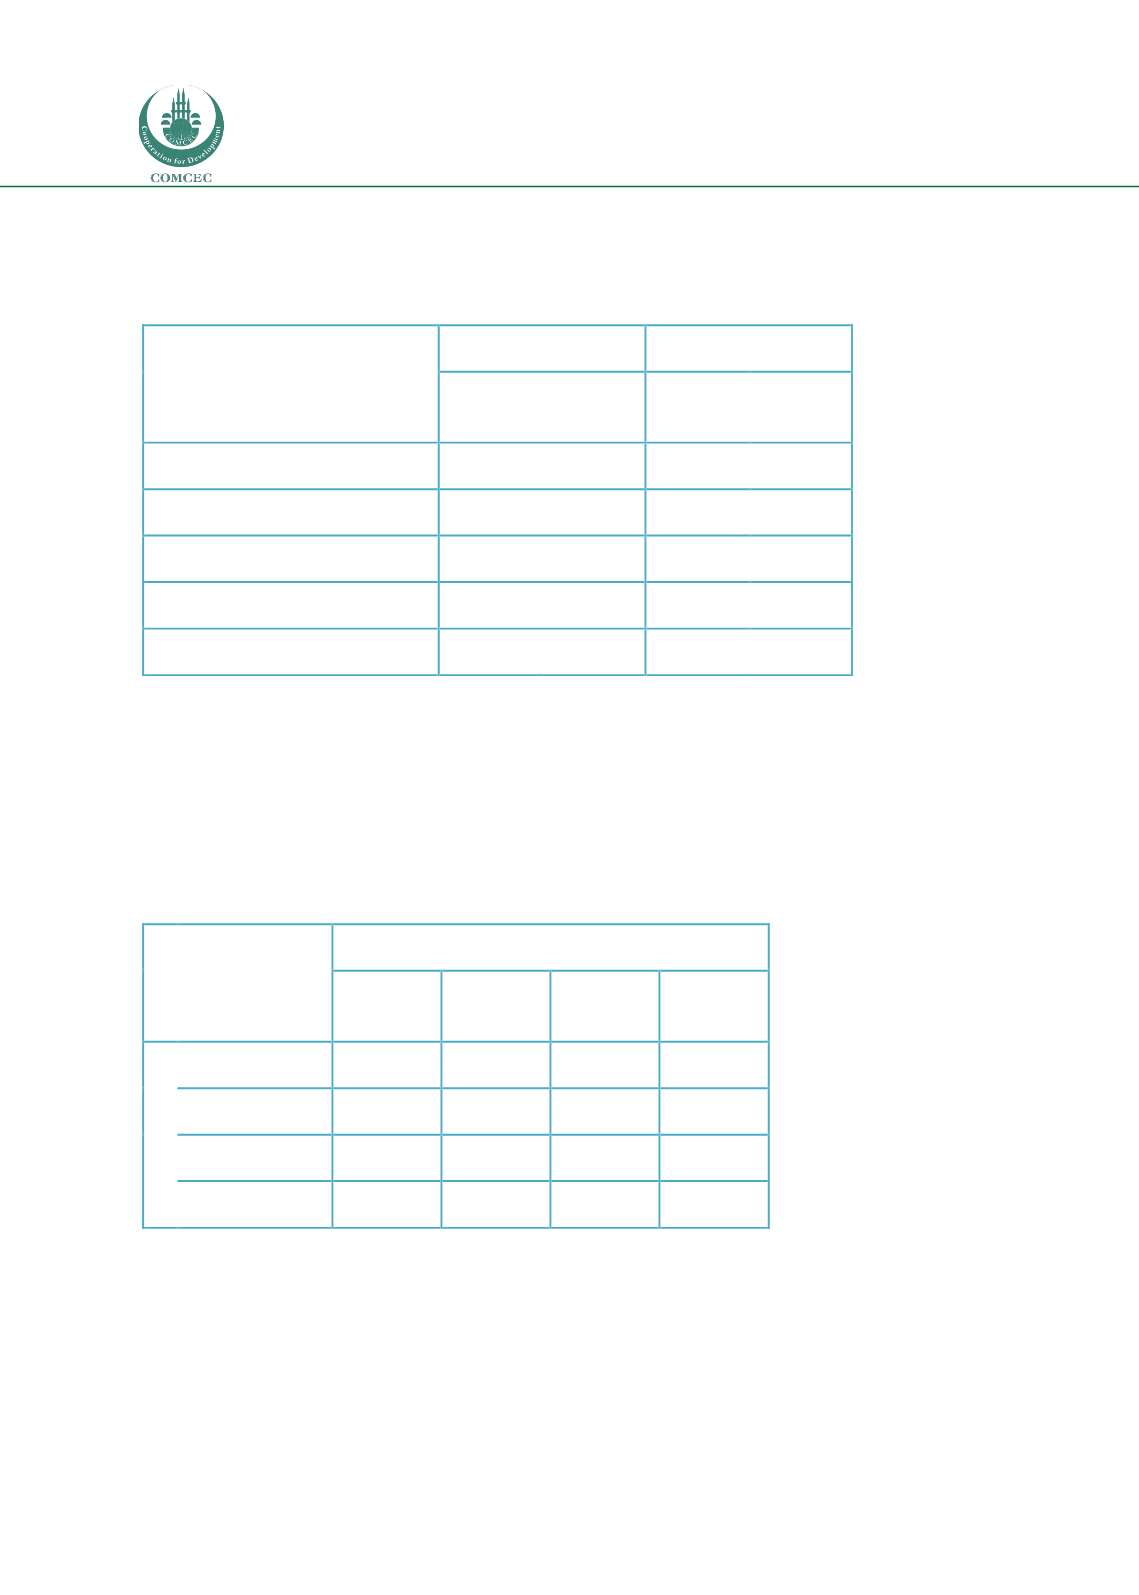
The transitions between categories from 2009 to 2015 are not suitable to interpret due to
previously mentioned methodological change. However, they are given i
n Table 10 to provide
insight.
Table 10: Transition between development categories from 2009 to 2015
2015
Low HD
Medium
HD
High HD
Very High
HD
2009
Low HD
14
0
0
0
Medium HD
9
12
7
0
High HD
0
0
7
2
Very High HD
0
0
0
4
Source: Own calculations from corresponding years HDR.
Note: The methodology of HDI has evolved over time. Therefore, the HDI values and hence categories are not
fully comparable over times