


 28 / 64

COMCEC Poverty Outlook 2016:
Human Development in OIC
20
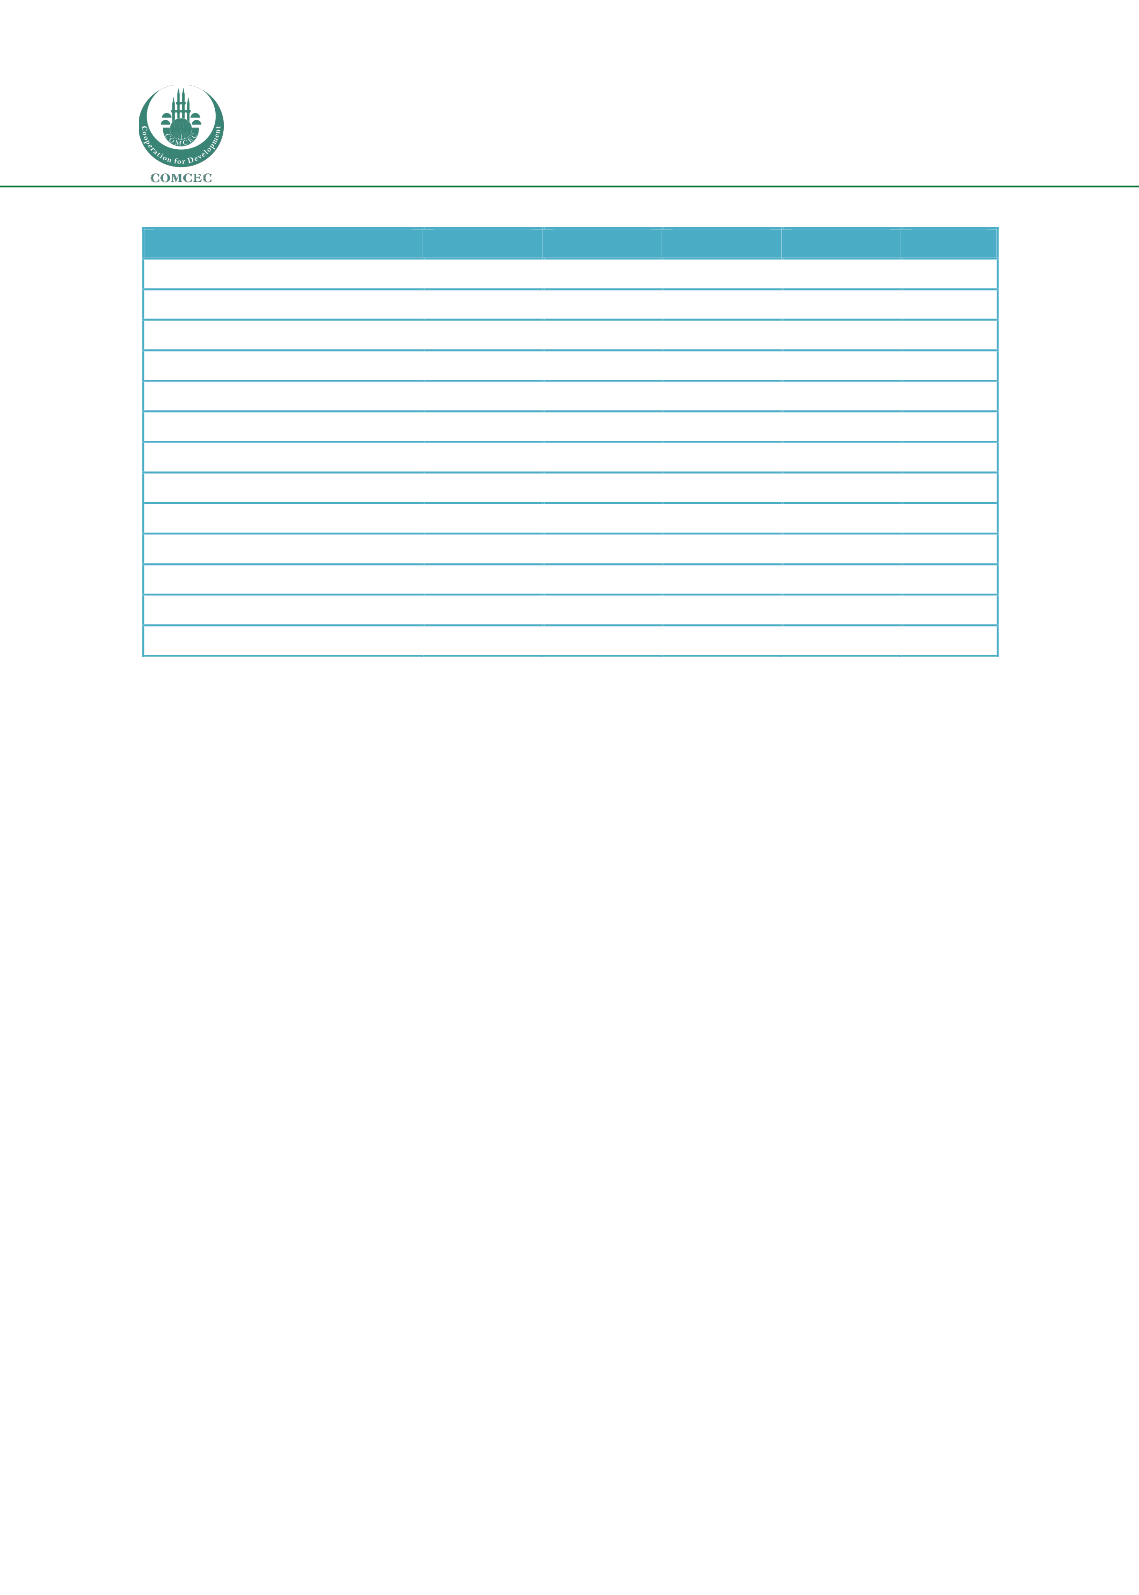
Table 4: Global Hunger Index Values of Low Income OIC Member Countries
Country
1990
1995
2000
2005
2015
Afghanistan
47,4
55,9
52,5
44,9
35,4
Benin
46,1
42,6
38,2
33,3
21,8
Burkina Faso
53,0
46,1
48,4
49,6
31,8
Chad
65,0
60,6
52,0
53,1
46,4
Gambia, The
36,4
35,4
27,9
26,3
21,5
Guinea
47,8
45,8
44,4
38,0
28,8
Mali
51,9
51,3
43,9
38,3
29,6
Mozambique
64,5
63,2
49,2
42,4
32,5
Niger
64,7
62,7
53,0
42,8
34,5
Senegal
36,8
36,9
37,9
28,5
23,2
Sierra Leone
58,8
56,0
53,5
52,4
38,9
Togo
42,5
44,1
38,6
36,4
23,0
Uganda
39,8
40,9
39,3
32,2
27,6
Source: IFPRI
et.al., 2015.
Note: Index values for Comoros and Somalia are not calculated.
2.
Trends in Human Development in OIC Member States
This section aims to analyze the trends in human development in OIC member states by
utilizing Human Development Reports (HDR) published by UNDP. Human development
requires expanding the richness of human life. This approach focuses on people and their
opportunities and choices rather than economy. Based on this paradigm, UNDP produces
HDR’s since 1990. Last report was published in 2015.
2.1.
International Comparison of Human Development Trends
Figure 20shows the change in human development index (HDI) for selected country groups
between 1990 and 2015. All of the selected groups experienced an increase in this period. The
world average has increased from 0.597 to 0.711. The OIC average rose from 0.505 to 0.616
and remained significantly below the OECD and world average. OIC’s HDI values are only
higher than those of LDCs. On the other hand, the gap between the OIC and developing
countries has enlarged in the last 25 years. In 1990, it was only 0.008 points whereas it has
risen to 0.044 points in 2015 implying a more rapid progress in developing countries.