


 32 / 64

COMCEC Poverty Outlook 2016:
Human Development in OIC
24
2.2.1.
Trends in OIC
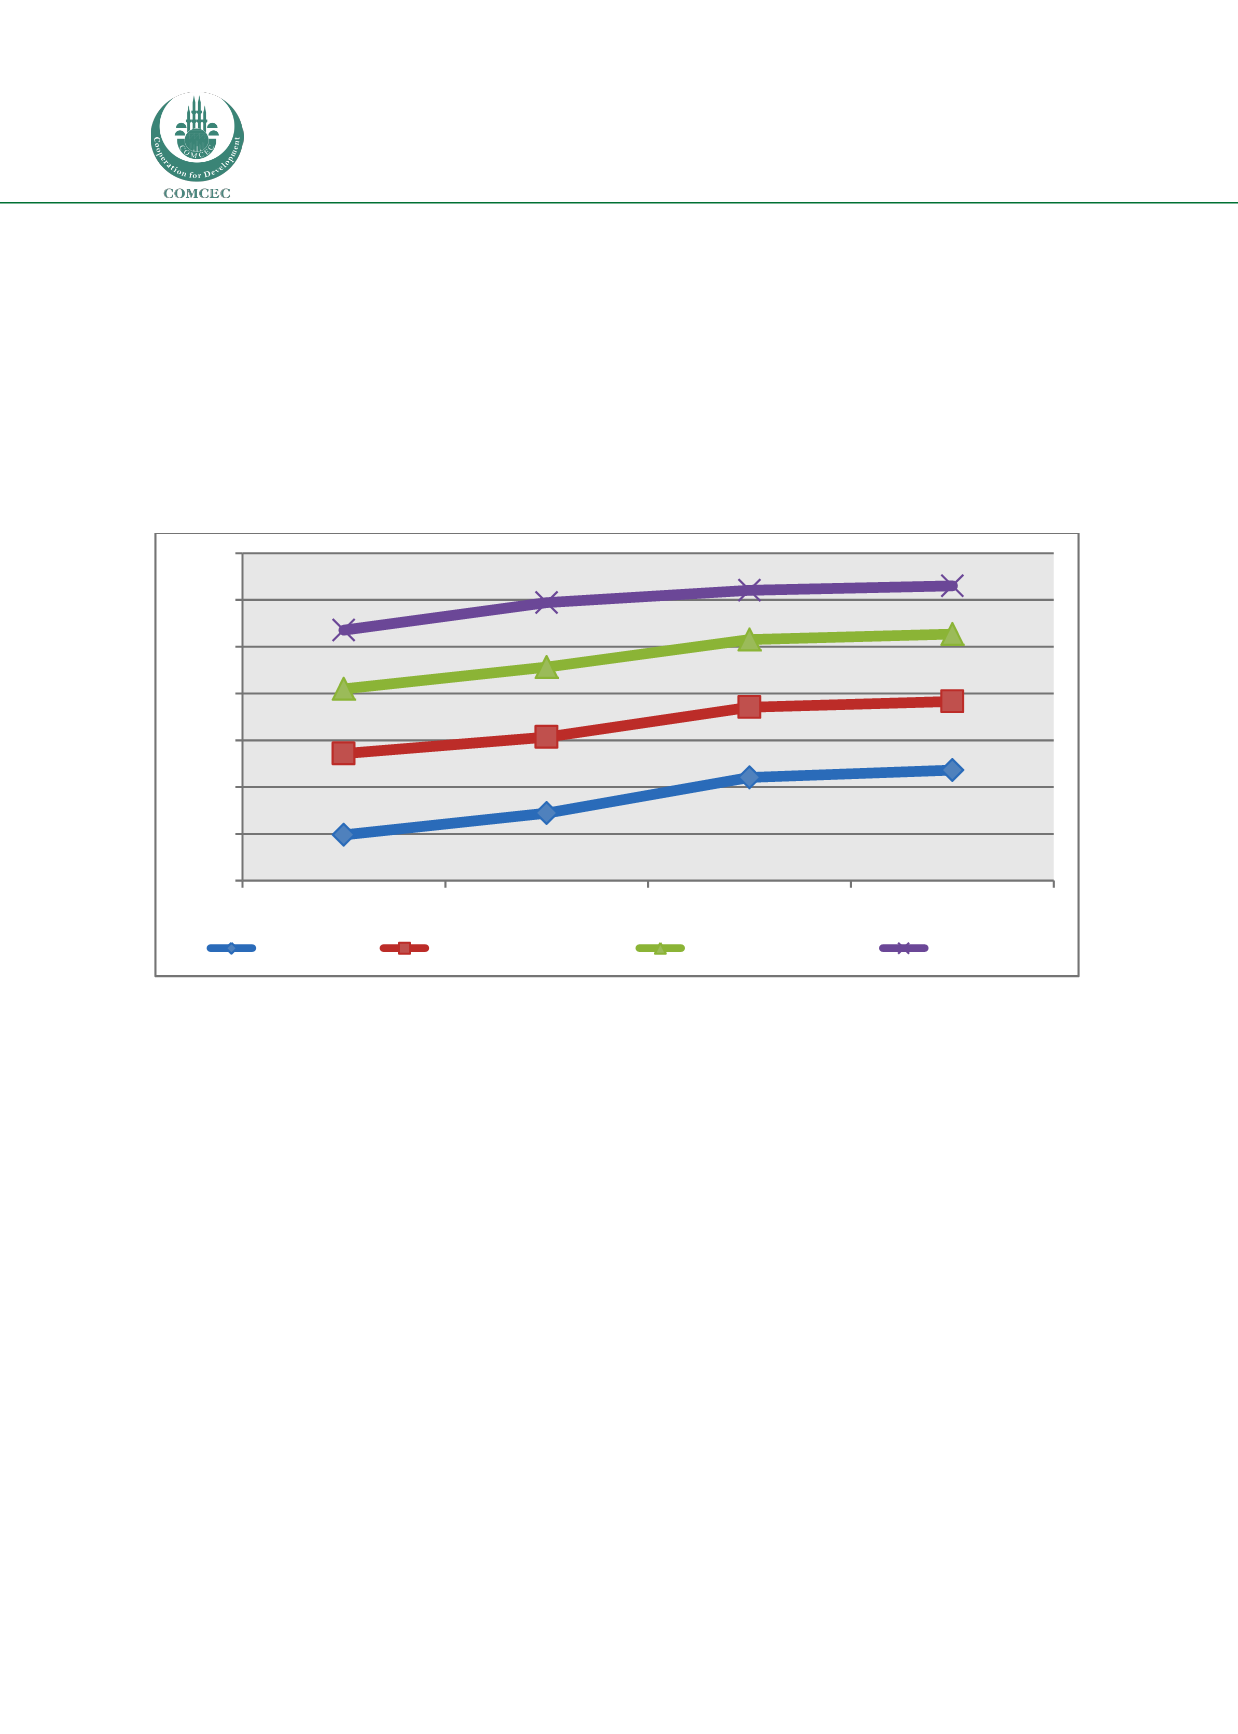
Figure 23shows the evolution of HDI for OIC member states in different income groups
between 1990 and 2015. It reveals that there is an improvement for each income group in the
defined period. It also clearly shows that the HDI values are strongly associated with income
level. The HDI values consistently increases as income group rises. High income and upper-
middle income countries exhibit HDI trends that are over the OIC average and the lower-
middle and low income countries have lower HDI values compared the OIC average.
Figure 23: Trends in Human Development Index of OIC Member States by income groups,
1990-2015
Source: Own calculations from UNDP (2015)
Note: The averages are unweighted. That is, each country in the groups has the same weight irrespective of its
population.
It worth mentioning that, the HDI level of low income countries in 2015 is even lower than that
of OIC average in 1990. This show that the low income countries could not catch up with 1990
OIC HDI level in the last 25 years. On the other hand,
Figure 24 reveals that there is a sign of
convergence. Accordingly, low income countries grew at much higher rates than other income
groups over the period. The growth rate of low income group was almost 3 times higher than
that of high income countries and two times higher than upper middle income group.
Another thing to note is that the high income group exhibits a higher level of annual growth
compared to OECD average. The same thing is true for low income countries when compared
with LDC’s.
0,298
0,345
0,420
0,436
0,472
0,507
0,571
0,583
0,610
0,657
0,716
0,727
0,736
0,795
0,820
0,830
0,200
0,300
0,400
0,500
0,600
0,700
0,800
0,900
1990
2000
2010
2015
Low income
Lower-middle income
Upper-midle income
High income