


 25 / 64

COMCEC Poverty Outlook 2016:
Human Development in OIC
17
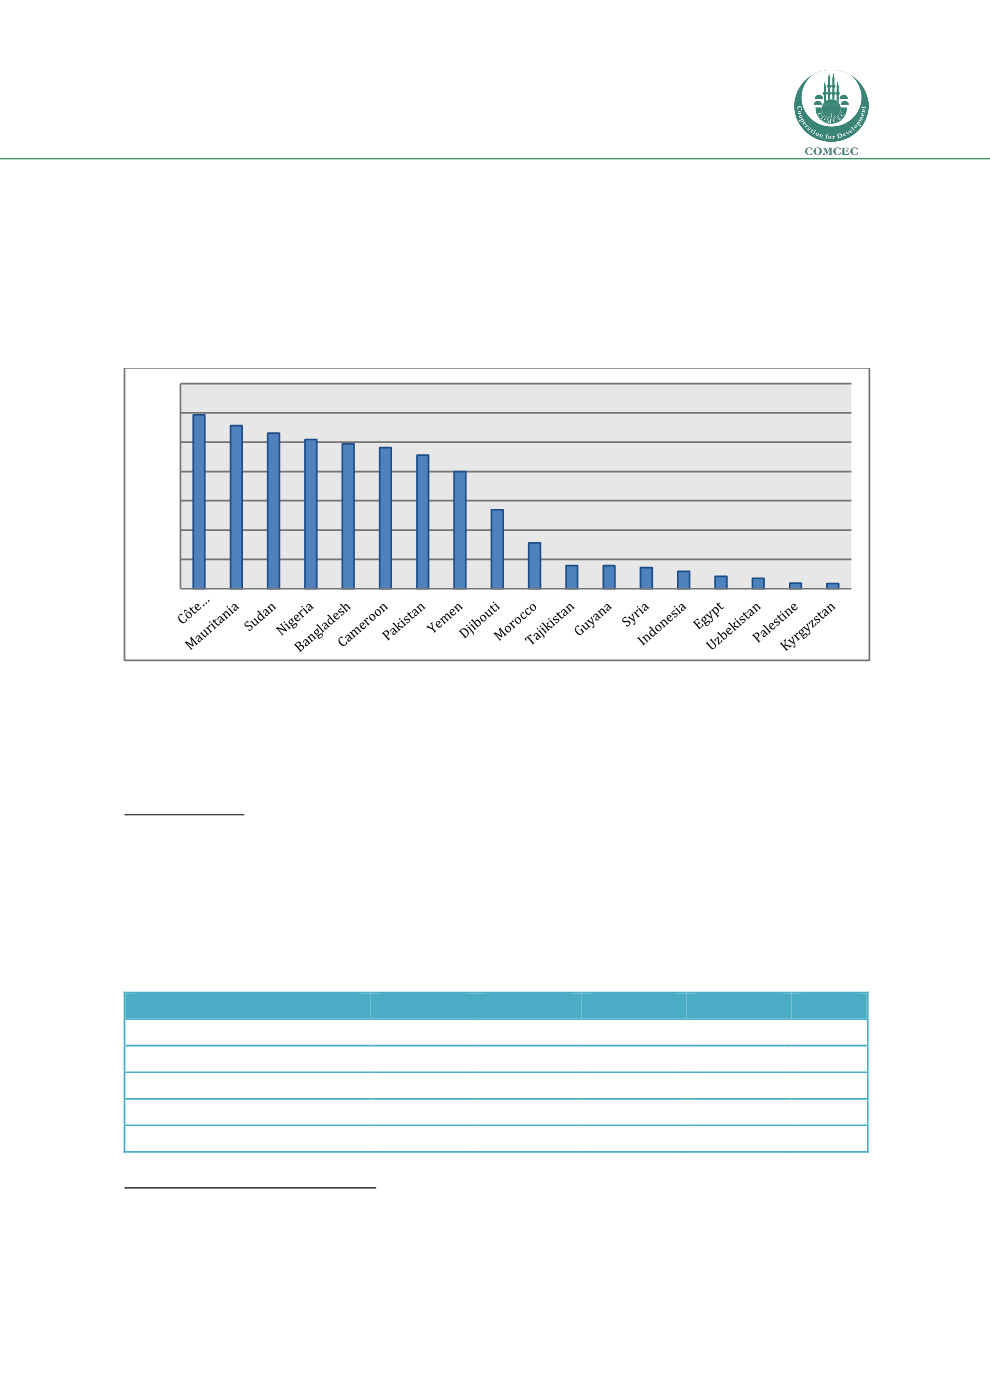
countries have an MPI value that is two-times or more higher than the highest MPI value in the
upper-middle income group. Indeed, the MPI values of half of the lower-middle income
countries are above 0.073 which is the highest MPI value of the upper-middle income group
(Figure 17). In this group, the share of population live in multidimensional poverty ranges
between 1,8 percent (Kyrgyzstan) and 59,3 percent (Cote d’Ivore). In almost half of the lower-
middle income countries, more than 40 perccent of the population is multi-dimensionally poor.
Figure 17: Multidimensional Poverty Rate in Lower-Middle Income OIC Member Countries
(%)
Source: The UNDP (2015).
The contribution of deprivation in education to overall multidimensional poverty ranges
between 3.7 (Uzbekistan) and 54.7 (Syria) and the contribution of deprivation in living
conditions ranges between 7.8 (Egypt) and 48.9 (Sudan), while the contribution of deprivation
in health is the highest which ranges between 20.3 (Mauritania) and 83.4 (Uzbekistan).
State of Hunger
In lower-middle income group, more than half of the countries, namely Bangladesh, Cameroon,
Djibouti, Cote d’Ivoire, Kyrgyzstan, Mauritania, Nigeria, Sudan, Syria, Tajikistan, Yemen,
Uzbekistan, and Senegal, are in the position of “low income food-deficit country”.
20
Looking at
the GHI values of the countries in this group, a similar picture is observed
(Table 3).
Table 3: Global Hunger Index Values of Lower-Middle Income OIC Member
Countries
Country
1990
1995
2000
2005
2015
Bangladesh
52,2
50,3
38,5
31,0
27,3
Cameroon
39,8
43,7
40,4
34,0
24,2
Côte d'Ivoire
33,8
32,1
31,4
32,7
26,3
Djibouti
56,1
56,1
48,5
46,1
33,2
Egypt
20,5
18,9
15,1
13,1
13,5
20
See Annex 5.
59,3
55,6 53,1 50,9 49,5 48,2 45,6
40,0
26,9
15,6
7,9 7,8 7,2 5,9 4,2 3,5 1,9 1,8
0,0
10,0
20,0
30,0
40,0
50,0
60,0
70,0