


 59 / 142

COMCEC Transport and Communications
Outlook 2017
40
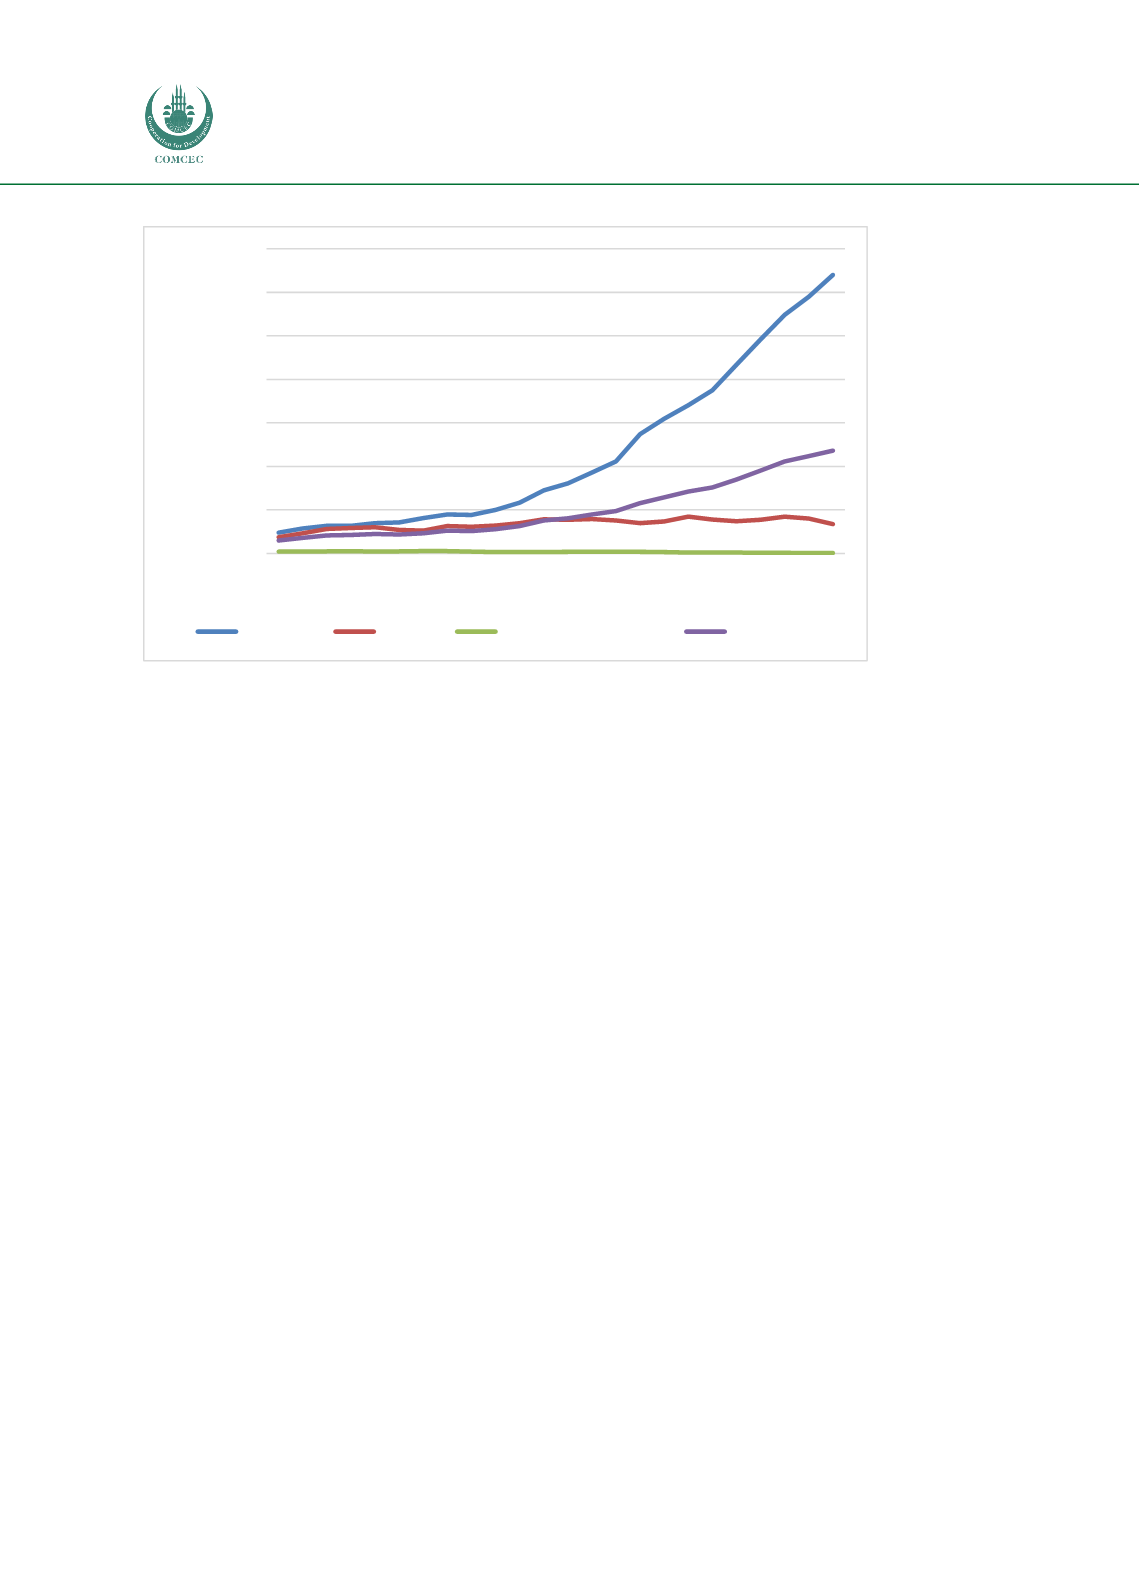
Figure 18: Total air freight carried in the OIC regions (million ton-km) (1993-2016)
Source: Author from the World Bank World Development Indicators, adjusted for missing data
0
5.000
10.000
15.000
20.000
25.000
30.000
35.000
1993
1994
1995
1996
1997
1998
1999
2000
2001
2002
2003
2004
2005
2006
2007
2008
2009
2010
2011
2012
2013
2014
2015
2016
Air Freight Traffic (million ton-km)
OIC-MENA
OIC-Asia
OIC-Sub Saharan Africa
OIC-Averaga