


 55 / 142

COMCEC Transport and Communications
Outlook 2017
36
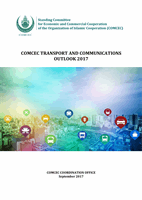
Figure 16: Container port traffic in the OIC regions (TEU: 20 foot equivalent units) (2014)
Source: The World Bank World Development Indicators
As of 2014, the container penetration intensity (share of containerisation in break bulk and
general cargo traffic) in several OIC countries were many times lower than the rate for the global
market (~100 TEU per 1,000 capita), and far lower than that of developed countries (~230 TEU
per 1,000 capita). Especially, some OIC countries such as Nigeria, Algeria, and Bangladesh show
very low container volumes in comparison with the size of their economies and populations as
Table 11 reveals. On the other hand, a few OIC countries (e.g. UAE and Oman) have very high
container penetration levels although their figures should be readjusted to account for their high
transhipment traffic.
Table 11: Container trade penetration in the OIC countries (2014) (including transhipment)
Country
TEU/1,000 capita
Country
TEU/1,000 capita
UAE
2,300
Iran
66
Djibouti
882
Tunisia
55
Oman
855
Indonesia
47
Malaysia
760
Benin
39
Kuwait
340
Côte d'Ivoire
35
Brunei
307
Albania
34
Bahrain
274
Yemen
33
Lebanon
266
Senegal
31
Maldives
234
Mauritania
21
Qatar
205
Cameroon
16
Saudi Arabia
205
Pakistan
14
Jordan
121
Sudan
14
Gabon
117
Mozambique
12
Turkey
100
Bangladesh
10
Egypt
98
Algeria
9
Morocco
91
Nigeria
6
Libya
73
Source: Author from UNCTAD and World Bank
OIC-MENA
56.835.873
OIC-Sub Saharan
Africa
5.020.792
OIC-Asia
39.084.111
-
10.000.000
20.000.000
30.000.000
40.000.000
50.000.000
60.000.000