


 49 / 143

COMCEC Transport and Communications
Outlook 2019
29
3.3.
M
ARITIME
T
RANSPORT
2
While all modes of transport are important, maritime transport needs special attention given
that almost 85% of global trade is carried by sea in terms of weight and thus ports can account
for a significant proportion of trade logistics and transport costs. (COMCEC, 2015)
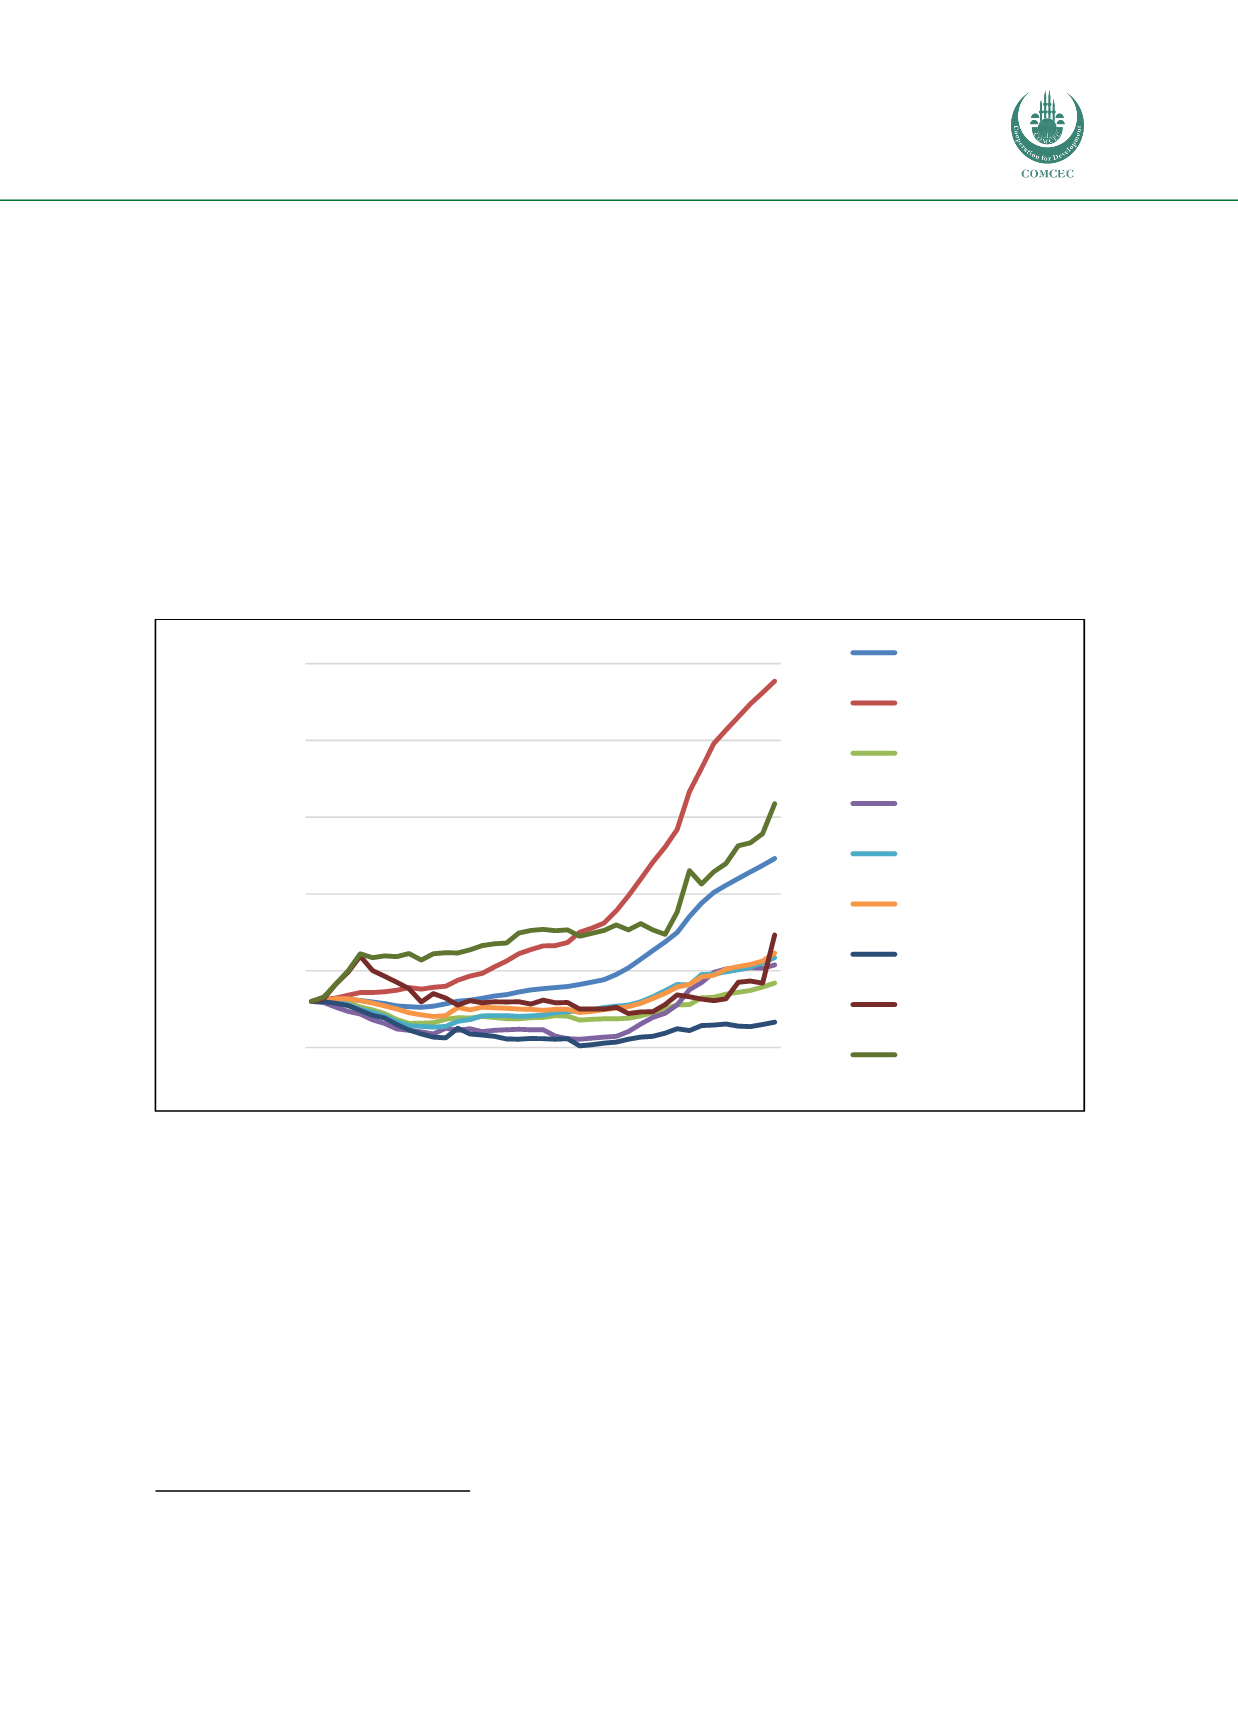
A measure that can be used as a proxy for the international trade is the change in global fleet.
Figure 13 shows, using UNCTAD data, the change in the total fleet, in dead weight tons in
thousands, by flag of registration for the 1980-2018 period. During this 29-year period, world
fleet has increased 186% while only two subgroup, i.e. developing economies and OIC,
outperformed this global average with a growth of 417% and 258%, respectively.
Figure 13: Change in total fleet by flag of registration (in 1000 dwt) (1980-2018)
Source: Author from UNCTAD Statistical Database
The increase in the commercial fleet registered under the flags of the OIC Member States
corresponds to a total capacity of 84.5 million deadweight tons (dwt) in 2018 compared with
23.6 million dwt in 1980. The majority of the fleet consist of oil tankers whereas container ships
represent only 8.2% of the total fleet. Considering the comparatively higher share of the OIC
countries in the world trade, i.e. around 10%, than that of the fleet capacity, it can be concluded
that the majority of the OIC’s merchandise trade is being carried by foreign shipping companies.
Although such a situation is a common trend in today’s globalized shipping industry, this often
leads to high maritime transport costs and low shipping connectivity particularly for the OIC
countries with smaller economies located in remote locations (COMCEC, 2015).
2
For a more detailed account on the subject, see COMCEC, “Evaluating the Ownership, Governance Structures
and Performances of Ports in the OIC Member Countries”, 2015.
40
140
240
340
440
540
1980
1982
1984
1986
1988
1990
1992
1994
1996
1998
2000
2002
2004
2006
2008
2010
2012
2014
2016
2018
Total fleet index
(Value in 1980=100)
World
Developing economies
Developed economies
LDCs (Least developed
countries)
EU28 (European Union)
G20 (Group of Twenty)
G8 (Group of Eight)
LAS (League of Arab
States)
OIC (Organisation of
Islamic Cooperation)