
COMCEC Transport and Communications
Outlook 2018
43
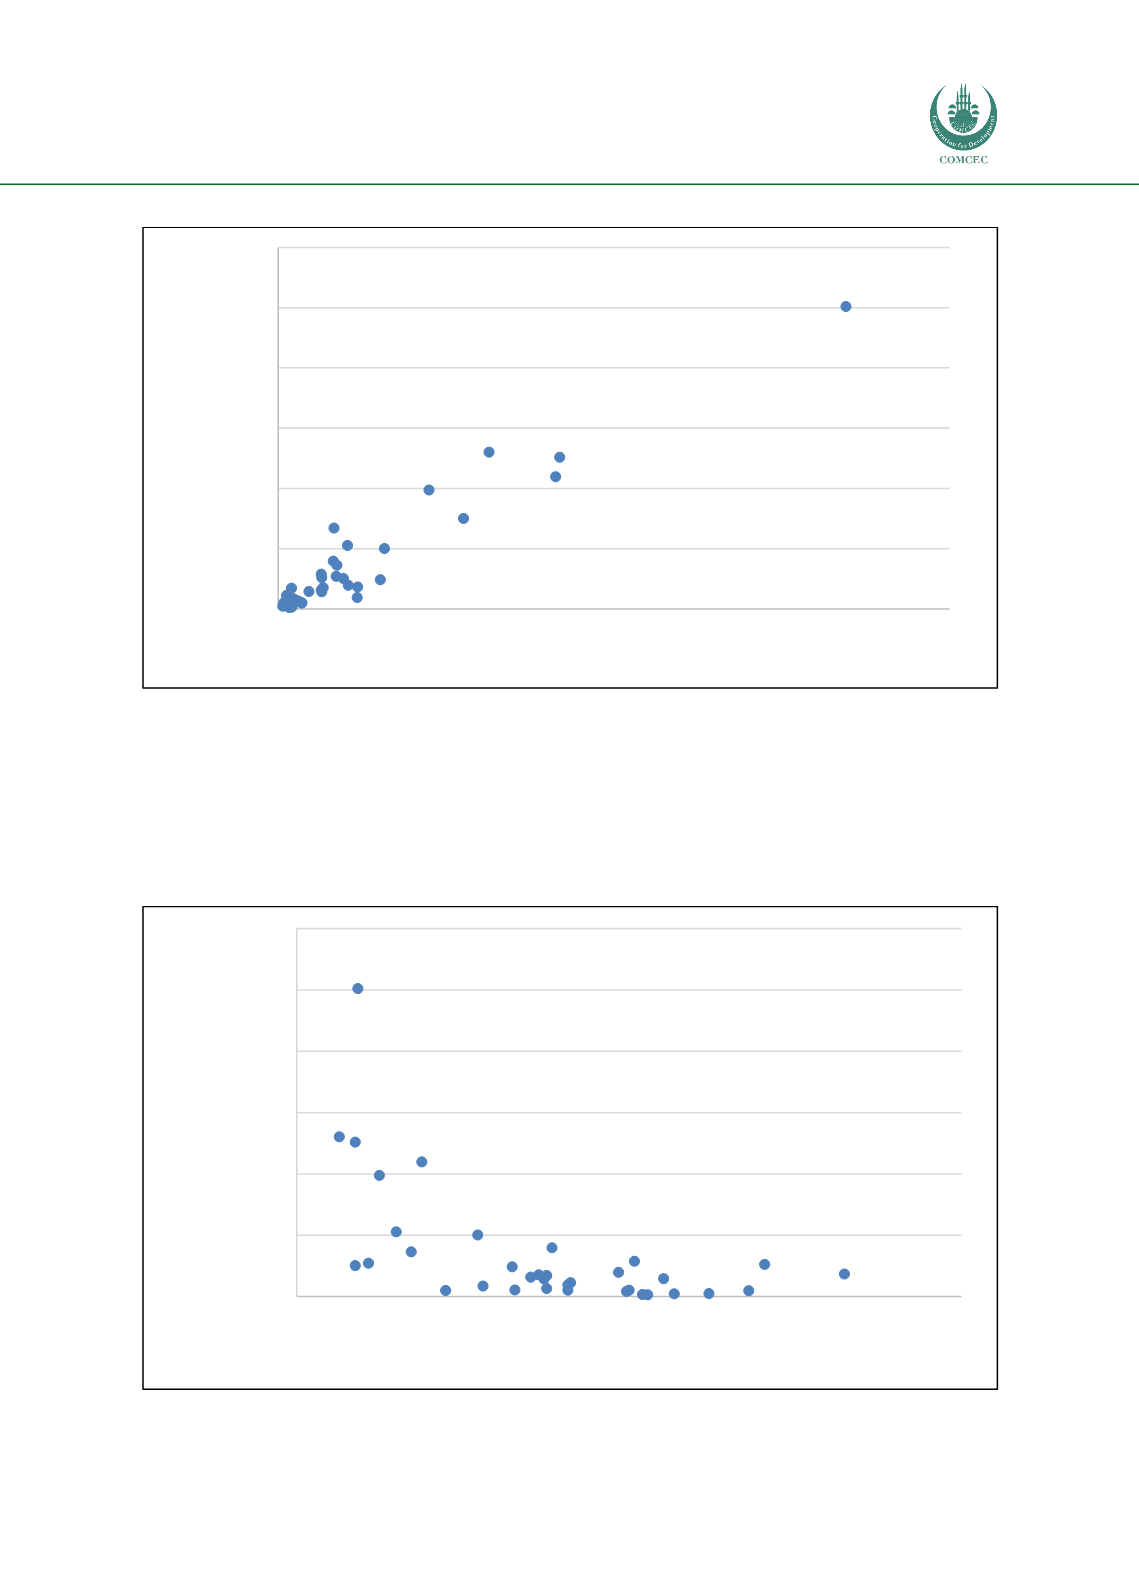
Figure 22: Road sector energy consumption and income per capita in OIC countries
Source: Author from the World Bank World Development Indicators
The pump price for gasoline is also a major determinant for road sector GHG emissions. Figure
23 shows that a negative relation exists between pump price for gasoline and road sector energy
consumption in 35 OIC countries in 2011 (which can be used as a proxy for GHG emissions).
Figure 23: Road sector energy consumption per capita and pump price for gasoline in the
OIC Member States (2014)
Source: Author from the World Bank World Development Indicators
Azerbaijan
Bahrain
Cameroon
Iran, Islamic Rep.
Kazakhstan
Kuwait
Lebanon
Libya
Oman
Qatar
Saudi Arabia
UAE
-
500
1.000
1.500
2.000
2.500
3.000
-
20.000 40.000 60.000 80.000 100.000 120.000 140.000 160.000
Road sector energy consumption per
capita (kg of oil equivalent) (2011)
GDP per capita (2015), PPP (constant 2011 $)
Albania
Algeria
Azerbaijan
Bangladesh
Benin
Iran
Iraq
Jordan
Kazakhstan
Kuwait
Lebanon
Malaysia
Nigeria
Oman
Qatar
Saudi Arabia
Senegal
Sudan
Turkey
UAE
-
500
1.000
1.500
2.000
2.500
3.000
0
0,5
1
1,5
2
2,5
Road sector energy consumption per
capita (kg of oil equivalent) (2011)
Pump price for gasoline (US$ per liter)


