


 69 / 144

COMCEC Transport and Communications
Outlook 2018
49
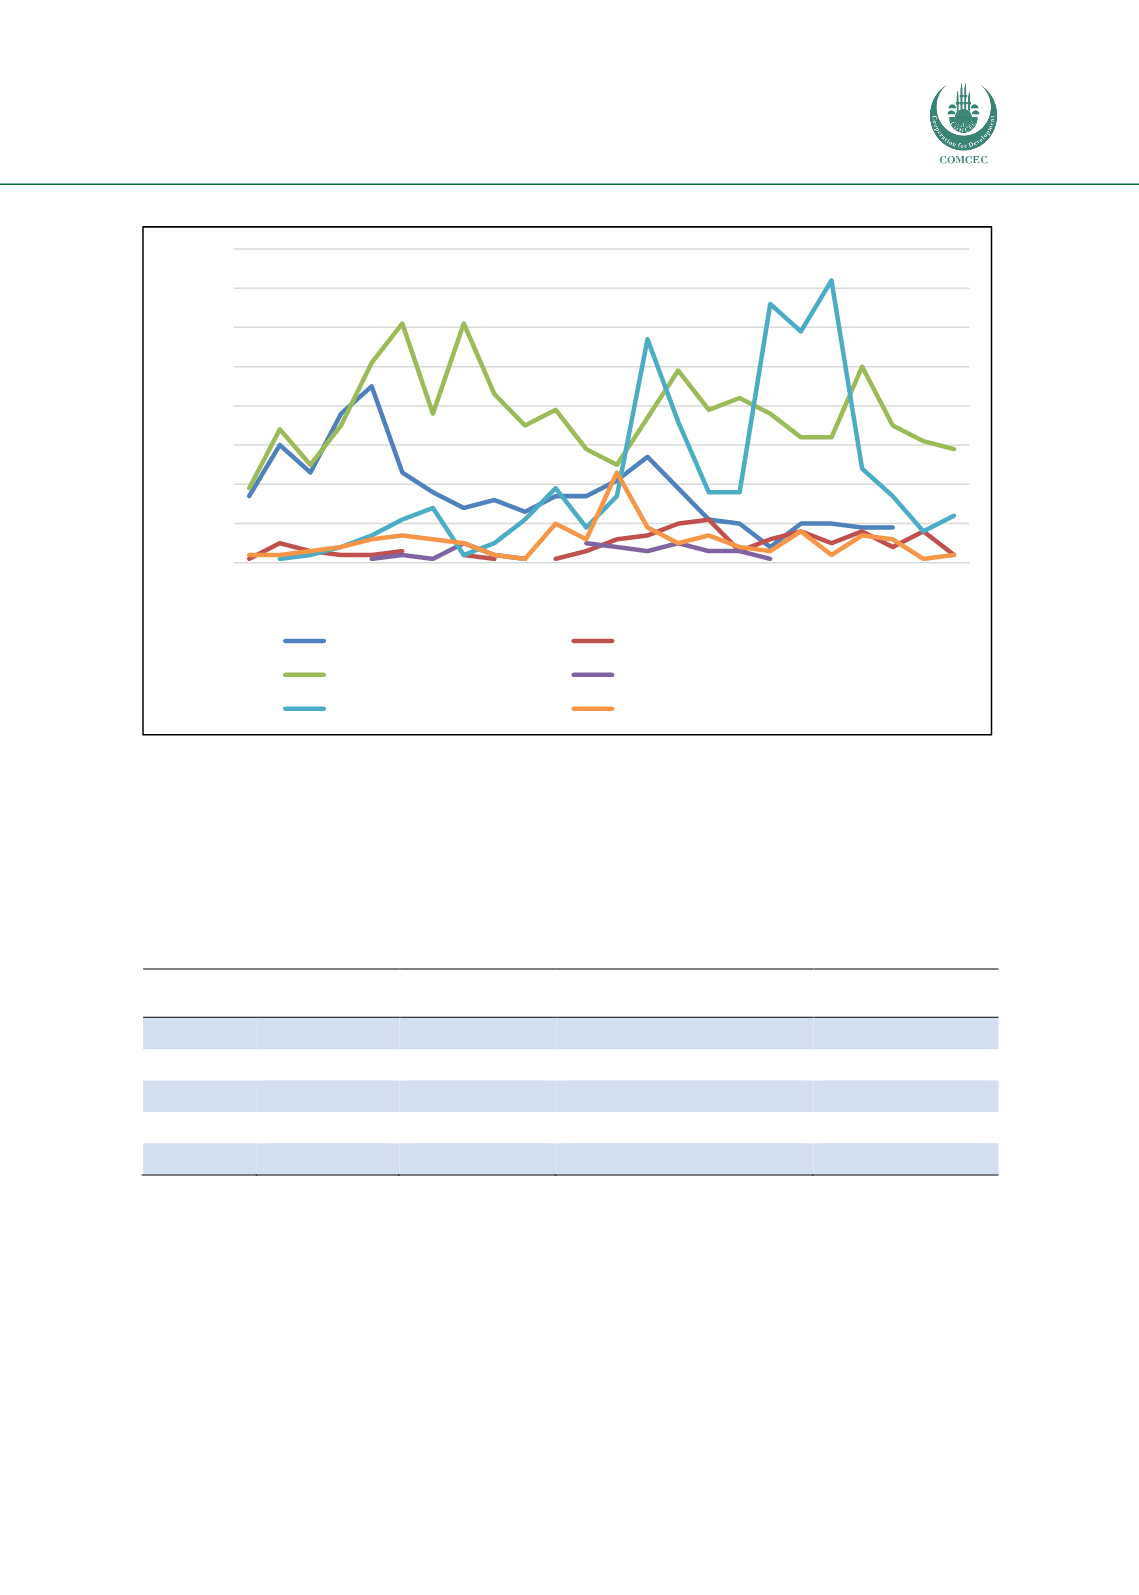
Figure 26: Changes in the number of transport PPI projects by regions (1991-2017)
Source: Author from the World Bank PPI Database
With respect to the distribution of transport PPI projects by modes, for roads the PPI projects
outnumbered others with a share of 48.4%while seaports, railroads, and airports had the shares
of 28.9%, 13%, and 9.7%, respectively. Table 17 provides the global transport PPI project counts
and their respective shares with regard to transport modes.
Table 17: Distribution of global transport PPI projects by modes (1991-2017)
Subsector
Project
Count
% Project
Count
Total Investment
Commitments (billion $)
% Total
Investment
Airports
204
9,7%
103,81
18%
Railroads
273
13%
117,72
20,4%
Roads
1.015
48,4%
271,4
47%
Seaports
605
28,9%
84,39
14,6%
Total
2.097
100%
577,32
100%
Source: Author from the World Bank PPI Database
0
10
20
30
40
50
60
70
80
1993
1994
1995
1996
1997
1998
1999
2000
2001
2002
2003
2004
2005
2006
2007
2008
2009
2010
2011
2012
2013
2014
2015
2016
Number of transport PPI projects implemented
East Asia and Pacific
Europe and Central Asia
Latin America and the Caribbean
Middle East and North Africa
South Asia
Sub-Saharan Africa