


 58 / 144

COMCEC Transport and Communications
Outlook 2018
38
Table 13: Air passengers carried at the OIC Member States (2017)
MENA
Sub-Saharan Africa
Asia
Turkey
107,917,32
6
Nigeria
3,446,717
Indonesia
110,252,91
3
UAE
95,306,296
Cote d'Ivoire
788,098
Malaysia
58,188,823
Saudi Arabia
37,503,000
Mozambique
569,829
Pakistan
9,919,768
Qatar
29,949,181
Togo
500,686
Kazakhstan
5,653,190
Iran
19,282,796
Mauritania
418,817
Bangladesh
3,785,509
Egypt
12,017,179
Sudan
328,741
Uzbekistan
2,581,865
Oman
9,065,019
Cameroon
236,000
Azerbaijan
2,331,308
Morocco
8,436,970
Burkina
Faso
145,049
Afghanistan
1,858,558
Algeria
6,241,924
Gabon
77,320
Maldives
1,485,752
Kuwait
5,586,034
Uganda
54,937
Turkmenistan
1,279,937
Bahrain
5,190,484
The Gambia
53,735
Brunei
Darussalam
1,172,201
Tunisia
4,194,174
Senegal
21,038
Kyrgyz Republic
1,127,285
Jordan
3,381,677
Niger
14,713
Tajikistan
796,383
Lebanon
2,869,266
Somalia
4,486
Suriname
284,935
Iraq
2,170,504
Libya
1,186,424
Yemen, Rep.
132,571
Source: Author from the World Bank World Development Indicators
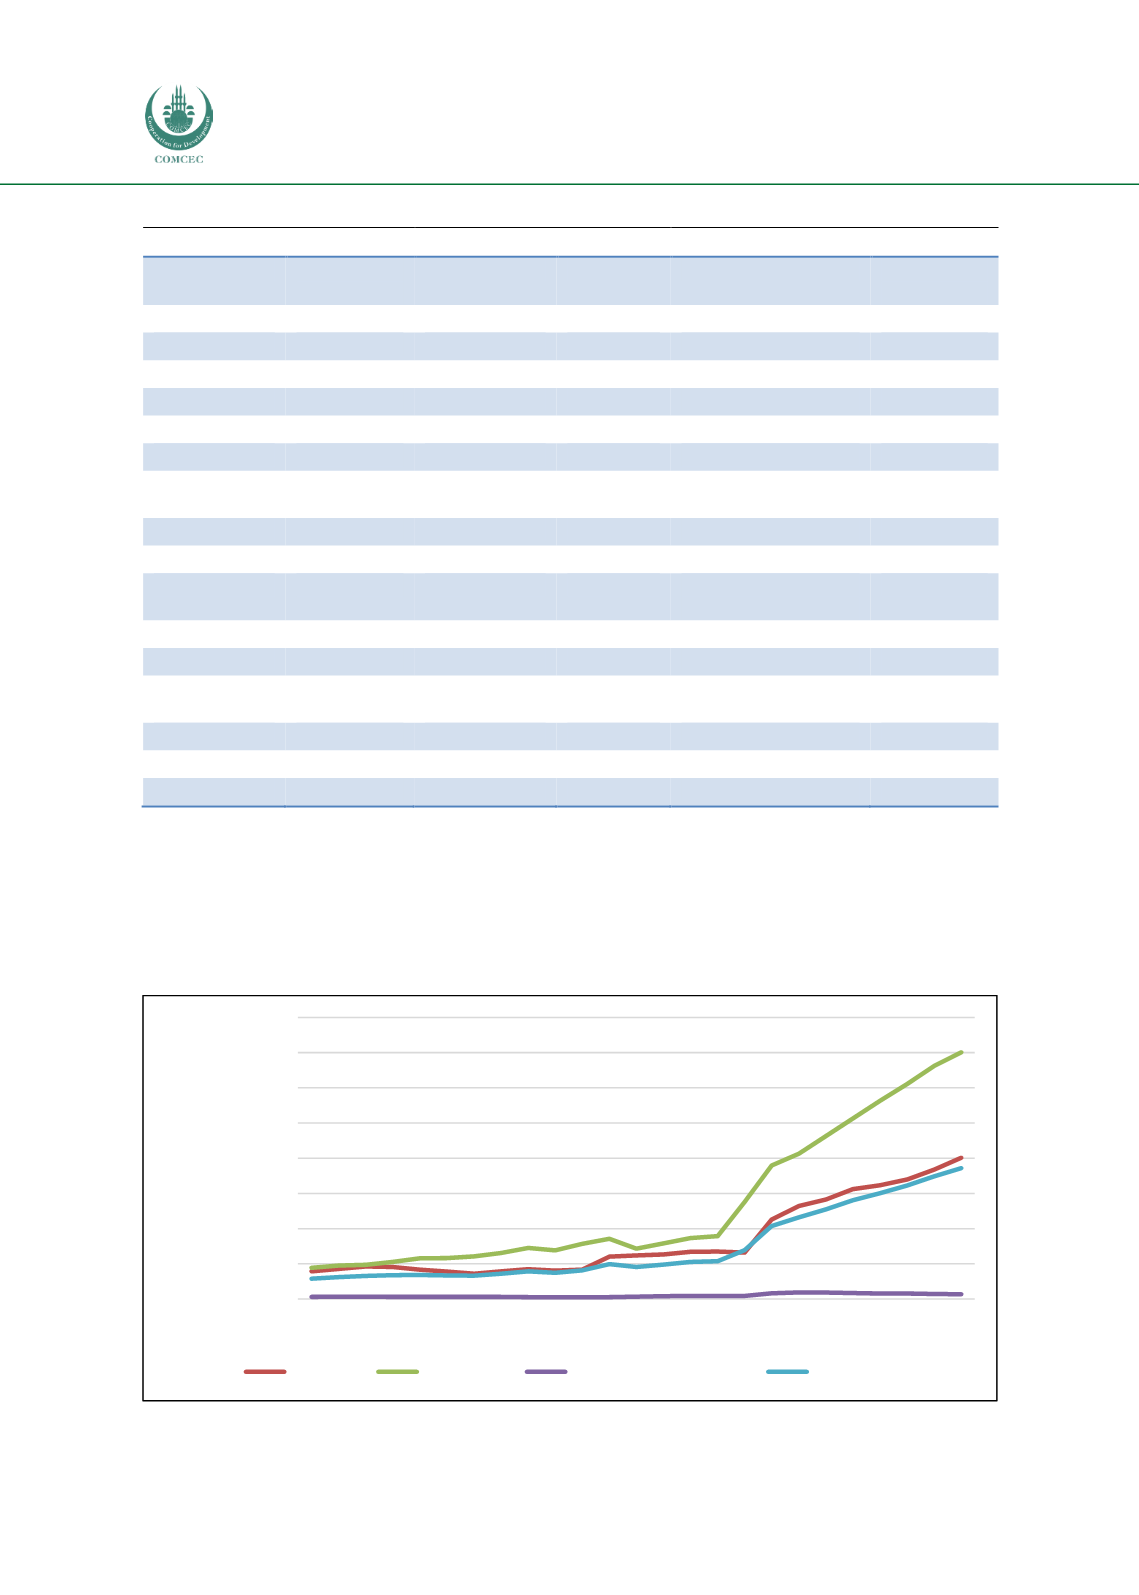
Regarding the number of air passengers throughout the 1993-2017 period, Figure 17 reveals
that OIC-MENA outperformed other regions since 1993 while OIC-Sub-Saharan Africa remained
well below the other regions during this period.
Figure 17: Total air passengers carried in the OIC regions (1993-2017)
Source: Author from the World Bank World Development Indicators
0
50000000
100000000
150000000
200000000
250000000
300000000
350000000
400000000
1993
1994
1995
1996
1997
1998
1999
2000
2001
2002
2003
2004
2005
2006
2007
2008
2009
2010
2011
2012
2013
2014
2015
2016
2017
Air passengers carried
OIC Asia
OIC MENA
OIC Sub-Saharan Africa
OIC Average