


 24 / 59

COMCEC Tourism Outlook-2019
14
Table 3.3 International Tourism Receipts by Region (Billion $)
Tourism Receipts
2000
2015
2017
2018
Share (%)
World
475
1,196
1332
1451
100
Europe
234.5
449.6
511,6
571
39.4
Asia & Pacific
86.7
349.4
389,5
436
30
Americas
132.8
305.6
325,7
334
23
Africa
10.8
32.8
37,8
38
2.6
Middle East
12.7
58.2
67,8
73
5
Source: UNWTO, Tourism Highlights 2002&2013&2017&2019 Edition
In Europe, international tourism receipts grew by 5%. In real terms Europe earned US$ 571
billion form international tourism arrivals, representing 39% of worldwide receipts.
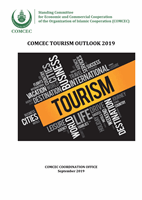
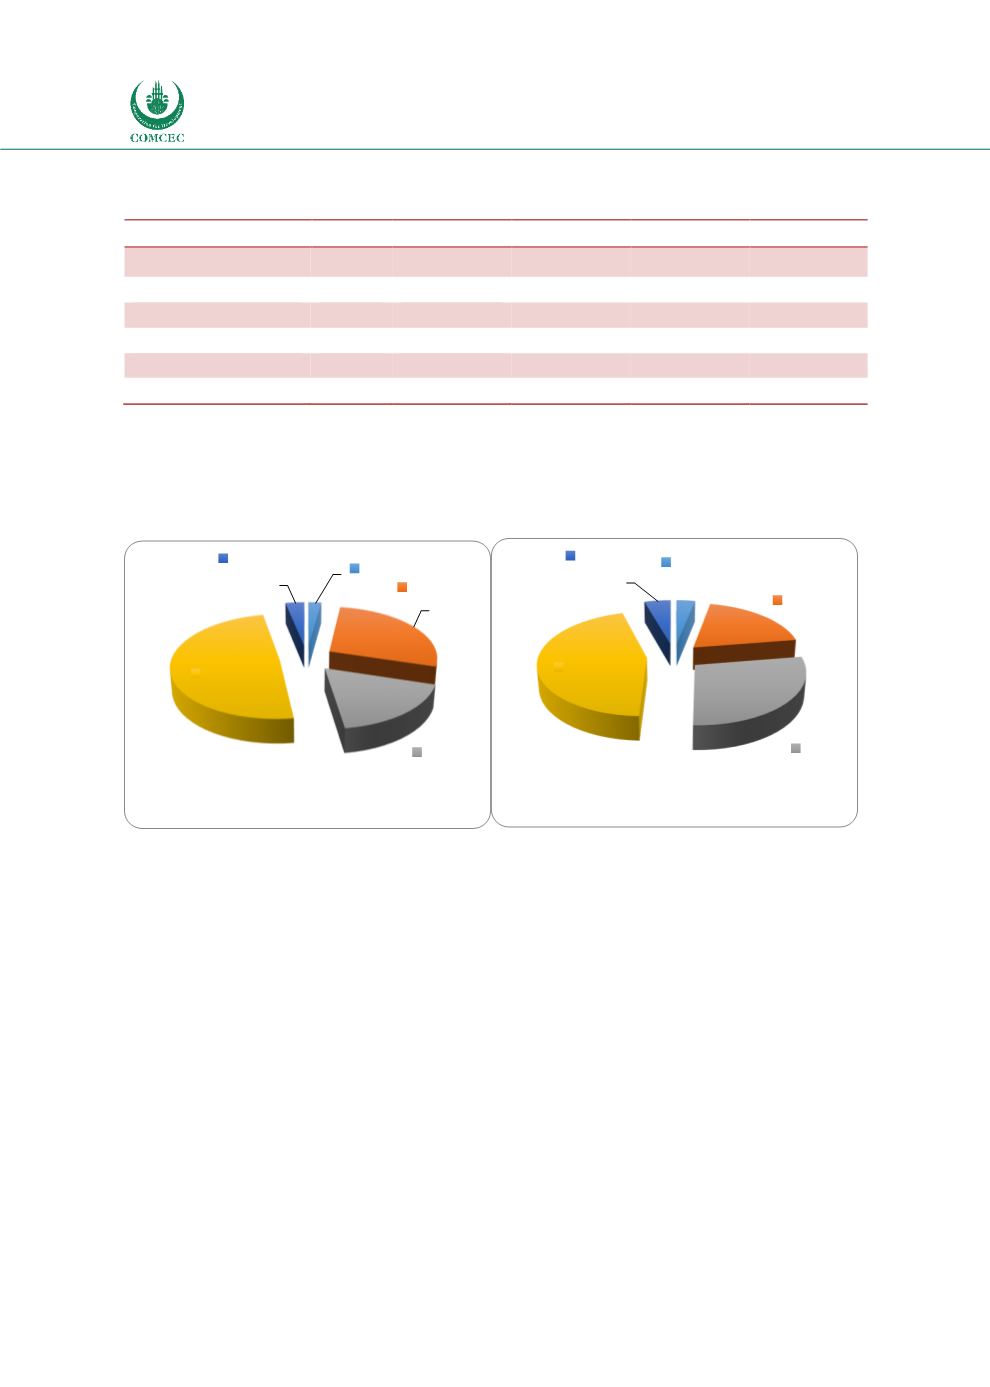
Figure 3.5 Tourism Receipts by Region (2000-2018)
Source: UNWTO, Tourism Highlights 2013 & 2017 Edition
Accounting for 30% of international receipts, in 2018, Asia-Pacific region earned US$ 436 billion
in international tourism receipts, this means an increase of 7% in real terms compared to 2016.
According to the UNWTO (2019a); Americas, accounts for 23% of international tourism receipts
worldwide, and increased its tourism receipts to US$334 billion.
Based on 2018 data, compared the growth rate in arrivals Africa experienced a modest increase
in receipts. Receiving 38 billion USD in 2018 the region enjoyed an increase of 2% in real terms
compared to 2017.
International tourism receipts in Middle East grew more than 4% to 73 billion US$ in 2018.
Strong recovery of Egypt and robust results in other major destinations lead to larger growth
rates.
Africa
2%
Americas
28%
Asia/
Pacific
18%
Europe
49%
Middle
East
3%
2000
Africa
3%
Americas
23%
Asia/
Pacific
30%
Europe
39%
Middle
East
5%
2018