


 21 / 59

COMCEC Tourism Outlook-2019
11
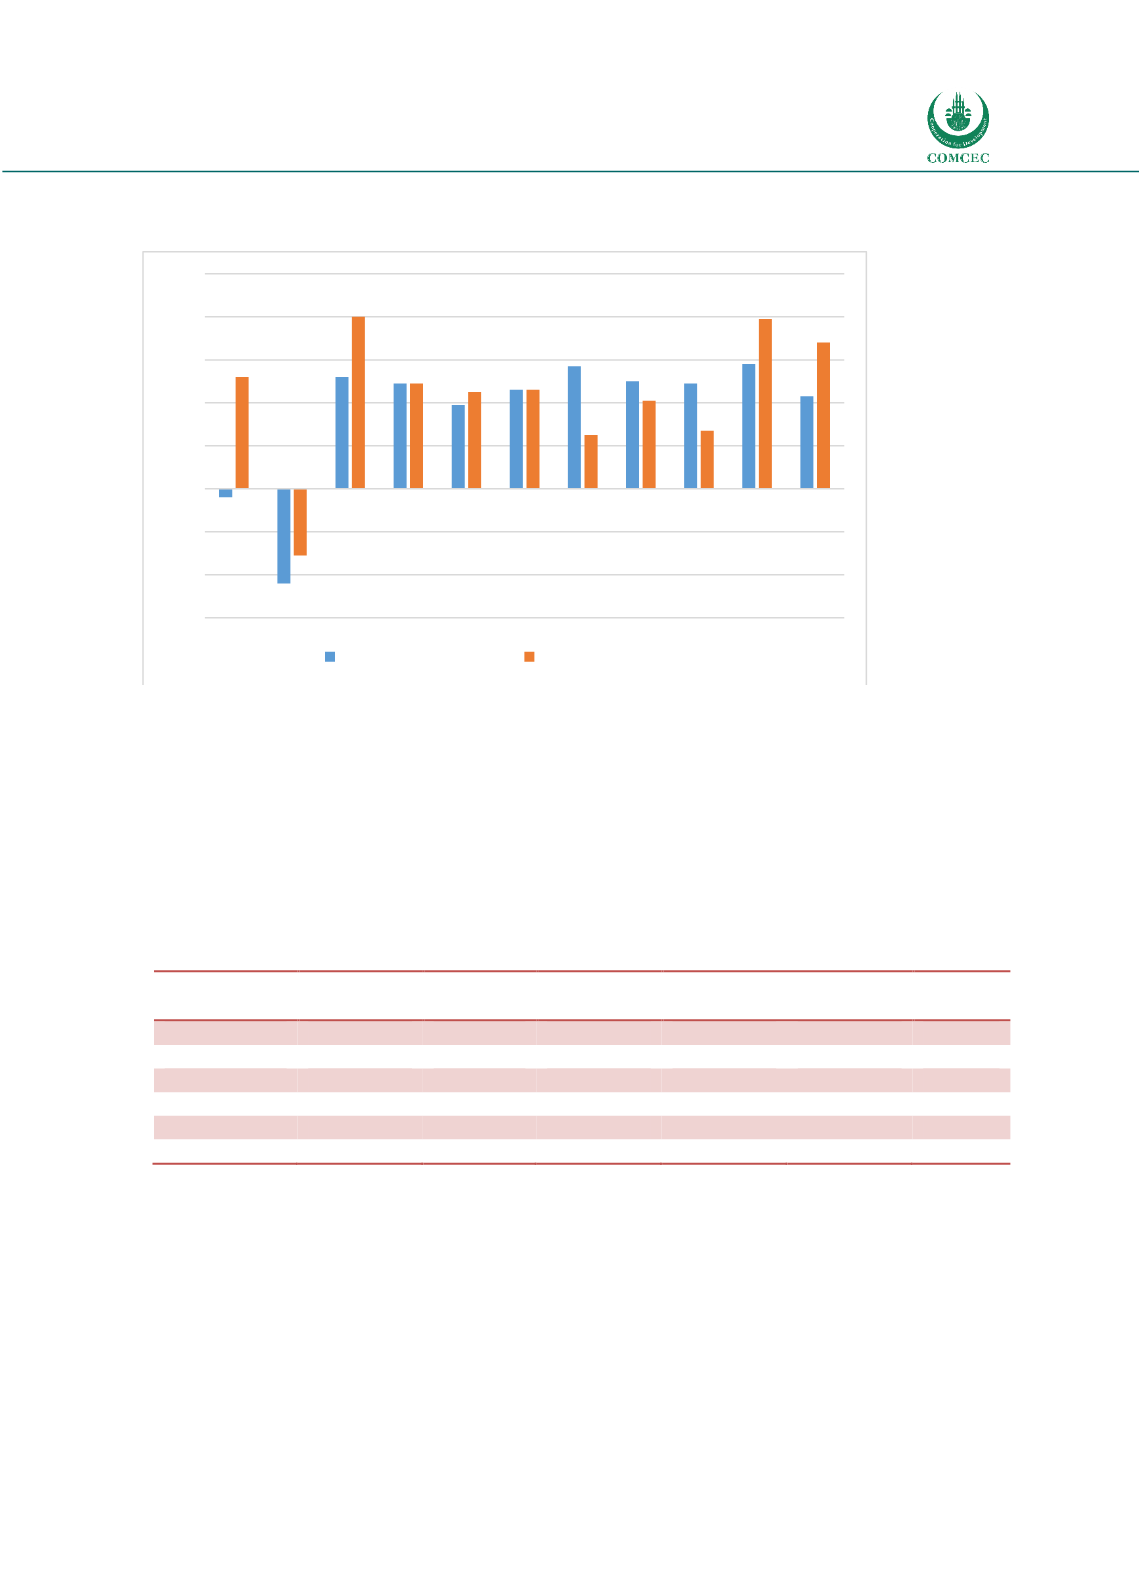
Figure 3.3 Change in International Tourist Arrivals (%)
Source: World Tourism Organization, Tourism Barometer 2017 July &Tourism Highlights 2017
In terms of regions, the UNWTO reports that Asia & Pacific and Africa (+7%) were the best
performers in 2018. Asia Pacific captured 25% of arrival and 30% of receipts with 348 million
international tourists. Growing purchasing power, relative safety, increased air connectivity,
more affordable travel and visa relaxation arrangements were major reasons of the growth. In
Africa Tunisia continued its recovery while Morocco and Mauritius grew at robust rates.
International arrivals to Africa totaled 67 million in 2018.
Table 3.2 International Tourism Arrivals by Region (Millions)
Tourist
Arrivals
2000
2010
2015
2017
2018
Share
(%)
World
674
949
1.186
1.329
1.401
100
Europe
386.4
488.7
607.6
673
710
51
Asia&Pacific
110.3
205.4
279.2
324
348
25
Americas
128.2
150.1
192.6
211
216
15
Africa
26.2
49.7
53.5
63
67
5
Middle East
22.4
54.8
53.3
58
61
4
Source: World Tourism Organization, 2019a
According to the Table 3.2, Europe (+5,5%), Asia and the Pacific (+7,3%), the Americas (+2,3%),
Africa (+7%), and Middle East (4,7%) all enjoyed growth.
In 2018, Europe (+6%) hosted half of the international tourists (710 million). This is an increase
of 39 million from 2017. Receipts also increased by 5% and reached 570 billion USD. Turkey
continued strong recovery with Italy, Russia, Greece, Portugal and Croatia in 2018. Yet, Brexit
still a challenge for European tourism.
-6,0
-4,0
-2,0
0,0
2,0
4,0
6,0
8,0
10,0
08/07 09/08 10/09 11/10 12/11 13/12 14/13 15/14 16/15 16/17 17/18
Advanced Economies
Emerging Economies