


 38 / 125

COMCEC Trade Outlook 2019
31
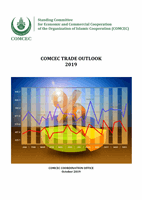
exporters of the commercial services trade had a share of more than 50 per cent in global
commercial services exports in 2016, 2017 and 2018.
Table 6: Top Commercial Services Exporters in the World
Countries
(Billion Dollars)
Share %
2016
2017
2018
2016
2017
2018
USA
740
778
808
14.9
14.5
14.0
UK
345
353
373
6.9
6.6
6.5
Germany
281
303
326
5.7
5.7
5.6
France
259
274
291
5.2
5.1
5.0
China
208
226
265
4.2
4.2
4.6
Netherlands
189
216
241
3.8
4.0
4.2
Ireland
149
180
205
3.0
3.4
3.6
India
161
185
204
3.2
3.4
3.5
Japan
171
182
187
3.4
3.4
3.2
Singapore
157
172
184
3.2
3.2
3.2
Top Ten Countries Total
2,660
2,869
3,084
53.6
53.6
53.5
World Total
4,962
5,358
5,770
Source: UNCTADSTAT
4.2. Trade in Commercial Services in the OIC Member Countries
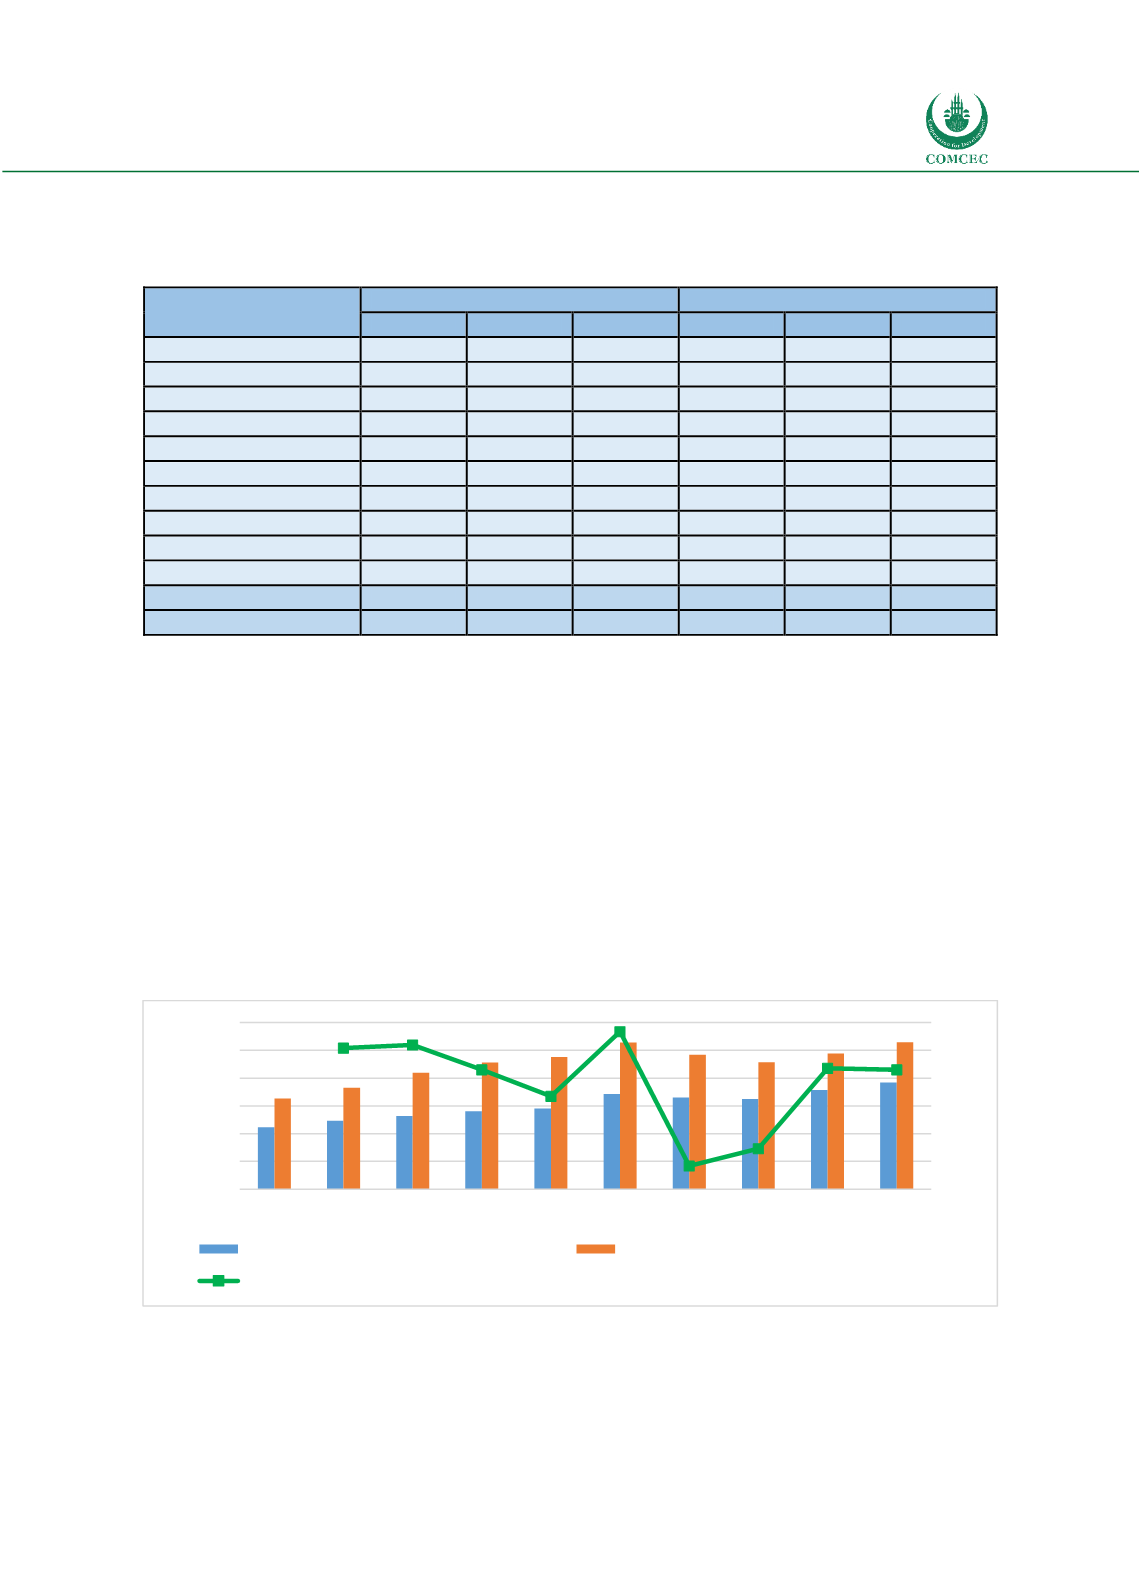
Total commercial services trade in the OIC reached its peak level in 2014 and recorded as 870
billion USD. Compare to the year 2014, this peak was exceeded in 2018 with 4.8 percent increase
and reached to 912 billion USD.
With respect to the structure of the trade in services, OIC services imports has dominated the
services exports in the last decade. Accordingly, the OIC commercial services exports constituted
only about 42 per cent of the total commercial services trade in 2018. However, services exports
grew at an annual average rate of 4.3 per cent while services imports grew by 3.1 per cent during
2009-2018 period. Thus, the share of services exports has increased over the last decade from
39 per cent in 2009 to 42 per cent in 2018.
Figure 37: Total OIC Commercial Services Exports and Imports
Source: UNCTADSTAT
Regarding the share of the OIC in global commercial services, the OIC Member Countries have
the share of 8.2 per cent in total global commercial services trade. Although this ratio peaked at
11.2
11.6
7.9
3.9
13.6
-6.5
-3.9
8.1
7.9
-10.0
-5.0
0.0
5.0
10.0
15.0
0
100
200
300
400
500
600
2009 2010 2011 2012 2013 2014 2015 2016 2017 2018
Billion USD
OIC Commercial Services Export
OIC Commercial Services Import
OIC Commercial Services Trade Growth (%)