


 33 / 125

COMCEC Trade Outlook 2019
26
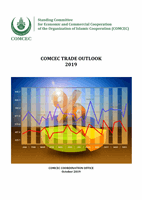
followed by pearls, precious stones
16
(9 per cent), electrical machinery (9 per cent), and
machinery and mechanical appliances (6 per cent).
Figure 30: Evolution of the shares of sectors in Intra-exports
Source: ITC Trade map
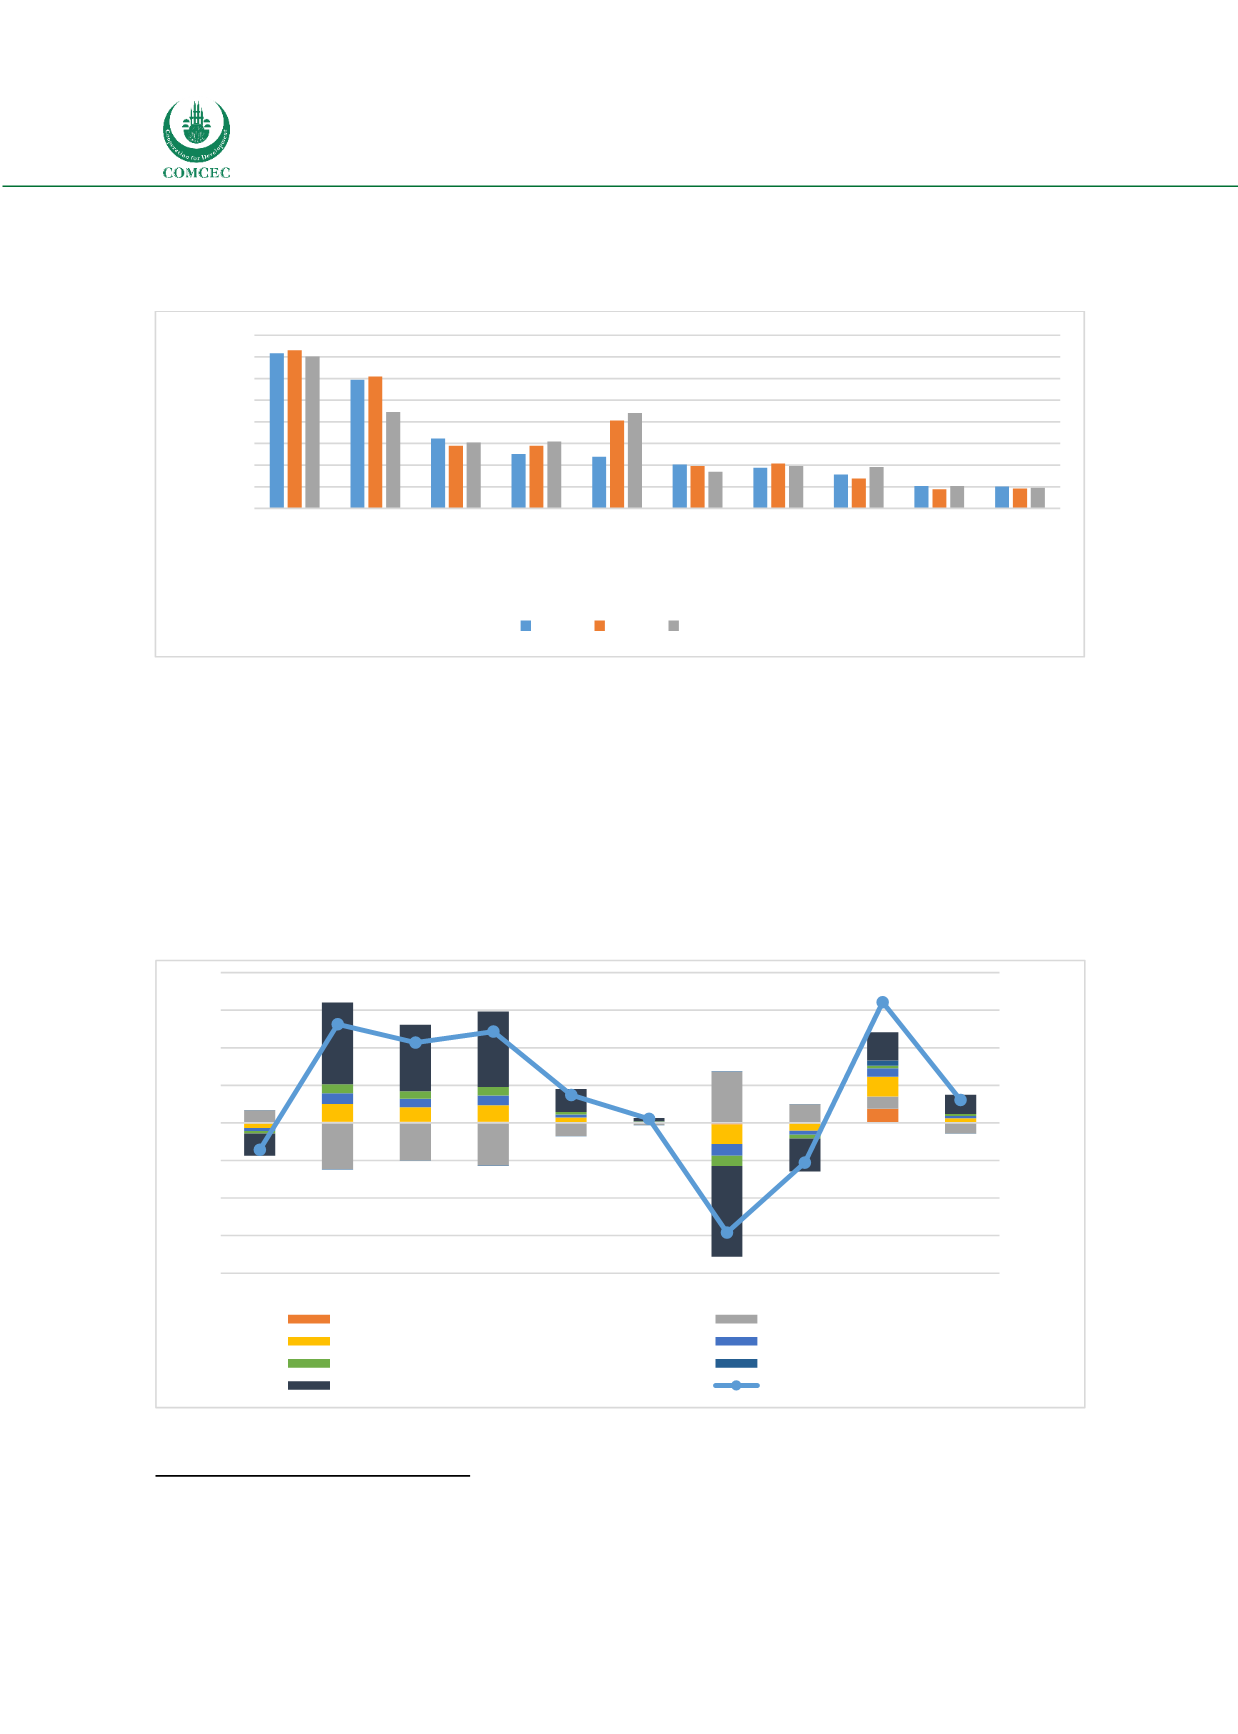
Figure 31 illustrates the contribution of sectors to the change in intra-OIC exports. Compared to
the year 2017, in-intra OIC exports decreased in all sectors (exports of electrical machinery,
natural or cultured pearls, precious stone, machinery and mechanical appliances and tobacco)
between -2.86 to 5.07 per cent in 2018.
Contribution of mineral fuels to the change in intra exports varies mainly depending on the oil
prices. The decreases in intra-exports of two sectors (pearls and precious stones and vehicles)
were substantial and went to -2.86 and -0.02 respectively.
Figure 31: Contribution of Sectors to the Change in Intra OIC Exports
Source: ITC Trade map
16
Composed of mainly (HS6 product code 7108) Gold, incl. gold plated with platinum, unwrought or not further worked
than semi-manufactured and (7113) Articles of jewellery and parts thereof, of precious metal or of metal clad with precious
metal
.
0
2
4
6
8
10
12
14
16
Mineral fuels,
mineral oils
etc.
Pearls,
precious or
semi-precious
stones etc.
Plastics and
articles
thereof
Machinery,
mechanical
appliances
etc.
Electrical
machinery
and
equipment
etc.
Animal or
vegetable fats
and oils etc.
Vehicles other
than railway
or tramway
rolling stock
etc.
Iron and steel Articles of
iron or steel
Aluminium
and articles
thereof
per cent
2016 2017 2018
-30
-20
-10
0
10
20
30
-40
-30
-20
-10
0
10
20
30
40
2009 2010 2011 2012 2013 2014 2015 2016 2017 2018
per cent
Mineral fuels
Natural pearls…
Electrical machnery
Machinery
Plastics and articles thereof
Vehicles
Others
Intra-OIC Exports (Second Axis)