


 37 / 125

COMCEC Trade Outlook 2019
30
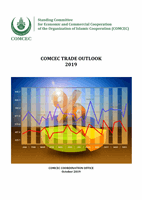
per cent on average during the same period. The figure reveals that the trade in services has
been increasing its importance and contribution to the global trade.
Figure 35: Global Goods and Commercial Services Export Values (Index 2005=100)
Source: UNCTADSTAT
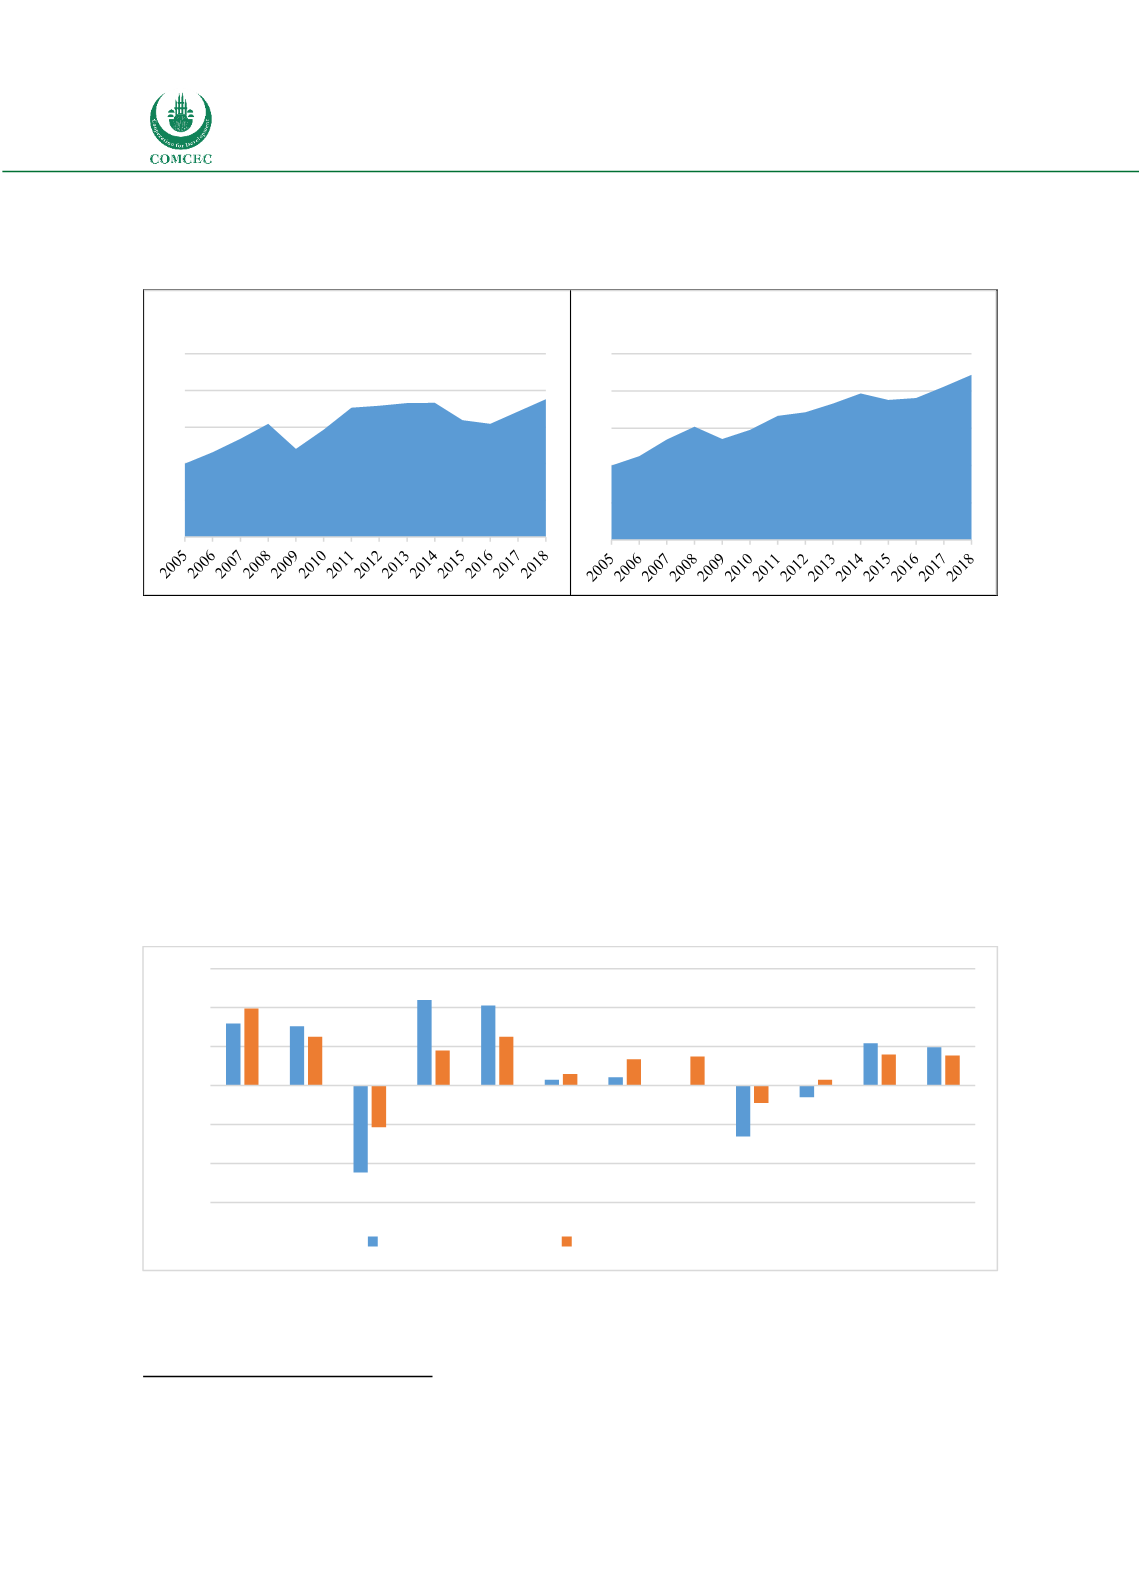
Moreover, the studies show that trade in services demonstrates higher resilience to the global
crisis compared to the merchandise trade
20
. Accordingly, during the global contractions in the
trade volume, the commercial services trade was not affected as much as merchandise trade.
The Figure 36 below shows that during 2009 financial crisis, despite the 22 per cent decline in
the volume of merchandise export, the commercial services only decreased about 10 per cent.
The same picture was also valid for the year 2015. The global merchandise exports decreased
about 13 percent whereas commercial services trade declined by only 4.5 per cent. The
development of the commercial services makes the economies stronger and resilient to the
external shocks. Therefore, considering the advantages of trade in services, many countries
incorporated trade in services into their national trade and growth strategies
21
.
Figure 36: Annual Growth of Merchandise and Commercial Services Export 2007-2018
Source: UNCTADSTAT
As the Table 6 below indicates, despite its importance for economies, the commercial services
trade is dominated by a few countries in the world. As the table below figures out, the top ten
20
UNDESA and UNCTAD: World Economic Situation and Prospects 2018: 24
21
UNCTAD,
https://unctad.org/en/conferences/gsf/2013/pages/importance-of-services.aspx15.9 15.2
-22.3
22.0 20.5
1.4 2.1 0.2
-13.1
-3.0
10.8
9.8
19.8
12.5
-10.7
9.0
12.6
3.0
6.8 7.5
-4.5
1.5
8.0 7.7
-30.0
-20.0
-10.0
0.0
10.0
20.0
30.0
2007 2008 2009 2010 2011 2012 2013 2014 2015 2016 2017 2018
Merchandise Export
Commercial Services Export
0
50
100
150
200
250
Total Goods Export
0
50
100
150
200
250
Total Commercial Services Export