


 34 / 125

COMCEC Trade Outlook 2019
27
The country breakdown of intra OIC trade which is provided in Appendix 4 reveals that intra
trade is highly concentrated as the sum of top three trading partners to total intra trade has a
very high ratio both in intra exports and intra imports. Moreover, it is observed that the
geographical proximity seems to be a major determinant of intra trade. Trade costs gets higher
with the distance between countries. This could be one of the factors accounting for the high
concentration of intra trade with the nearby countries.
3.2. Intra-OIC Merchandise Imports
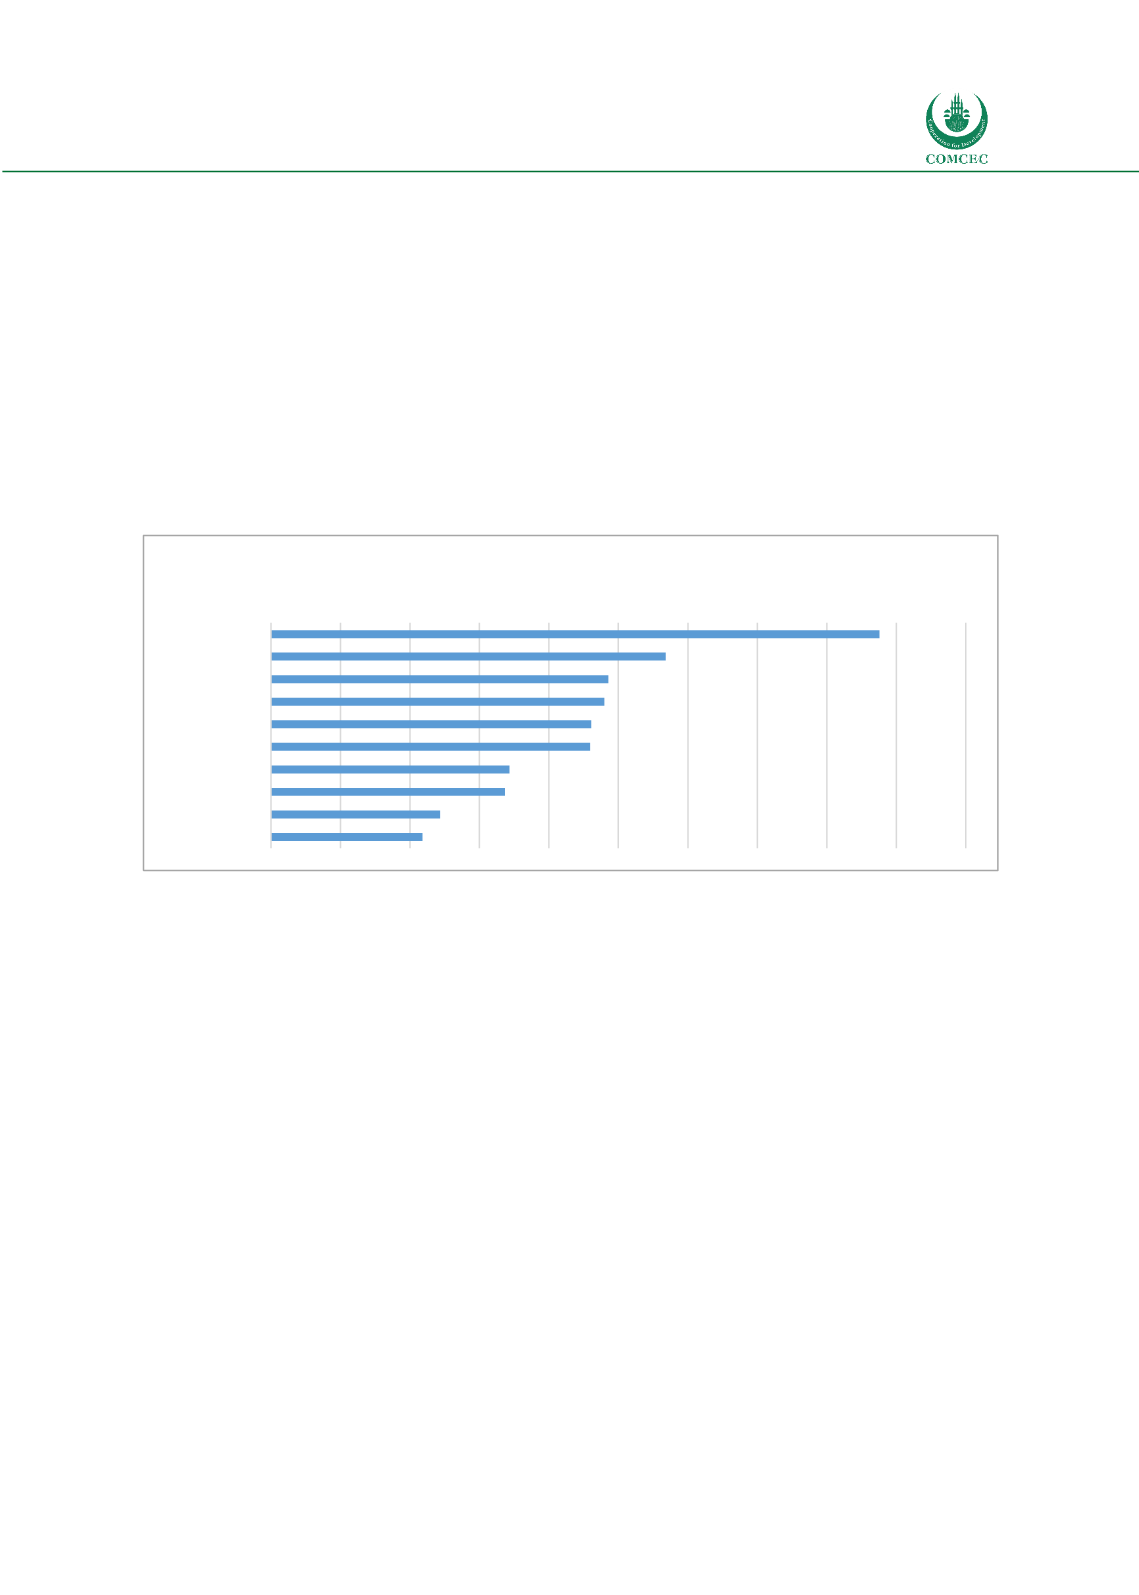
The intra-OIC imports of UAE had the highest share in total intra OIC imports with 44 billion
USD USD followed by Turkey with 28 billion USD and Saudi Arabia and Indonesia with 24 billion
USD.
Figure 32: Intra OIC Imports in 2018
Source: IMF Direction of Trade Statistics
3.3. Intra Trade Balance
Comparison of countries whether they are net intra-exporters or net intra-importers could
provide some insights. Since there is great variation in terms of absolute values of trade across
OIC countries, the ratio of intra exports to intra imports could be used in order to compare the
value of imports against exports. According to this ratio those countries with a value less than
100 per cent are net intra-importers (i.e. they import more goods from OIC than they export to
other OIC countries) while those with a value more than 100 per cent are net intra-exporters.
Figure 33 depicts that fifteen OIC countries have a ratio over 100 implying that they are net intra
exporters. Suriname which has the largest intra-trade surplus ranks first and followed by
Bahrain, Nigeria, Togo, Kazakhstan, Saudi Arabia, Qatar, Turkmenistan and Turkey. On the other
hand 41 OIC countries with a ratio below 100 are net intra importers. Among these net intra-
importers Maldives ranks first followed by Gambia, Comoros, Albania and Sierra Leone.
44
28
24
24
23
23
17
17
12
11
0
5
10 15 20 25 30 35 40 45 50
UAE
Turkey
Saudi Arabia
Indonesia
Pakistan
Malaysia
Egypt
Oman
Iraq
Iran
Billion USD