


 47 / 101

COMCEC Agriculture Outlook 2017
37
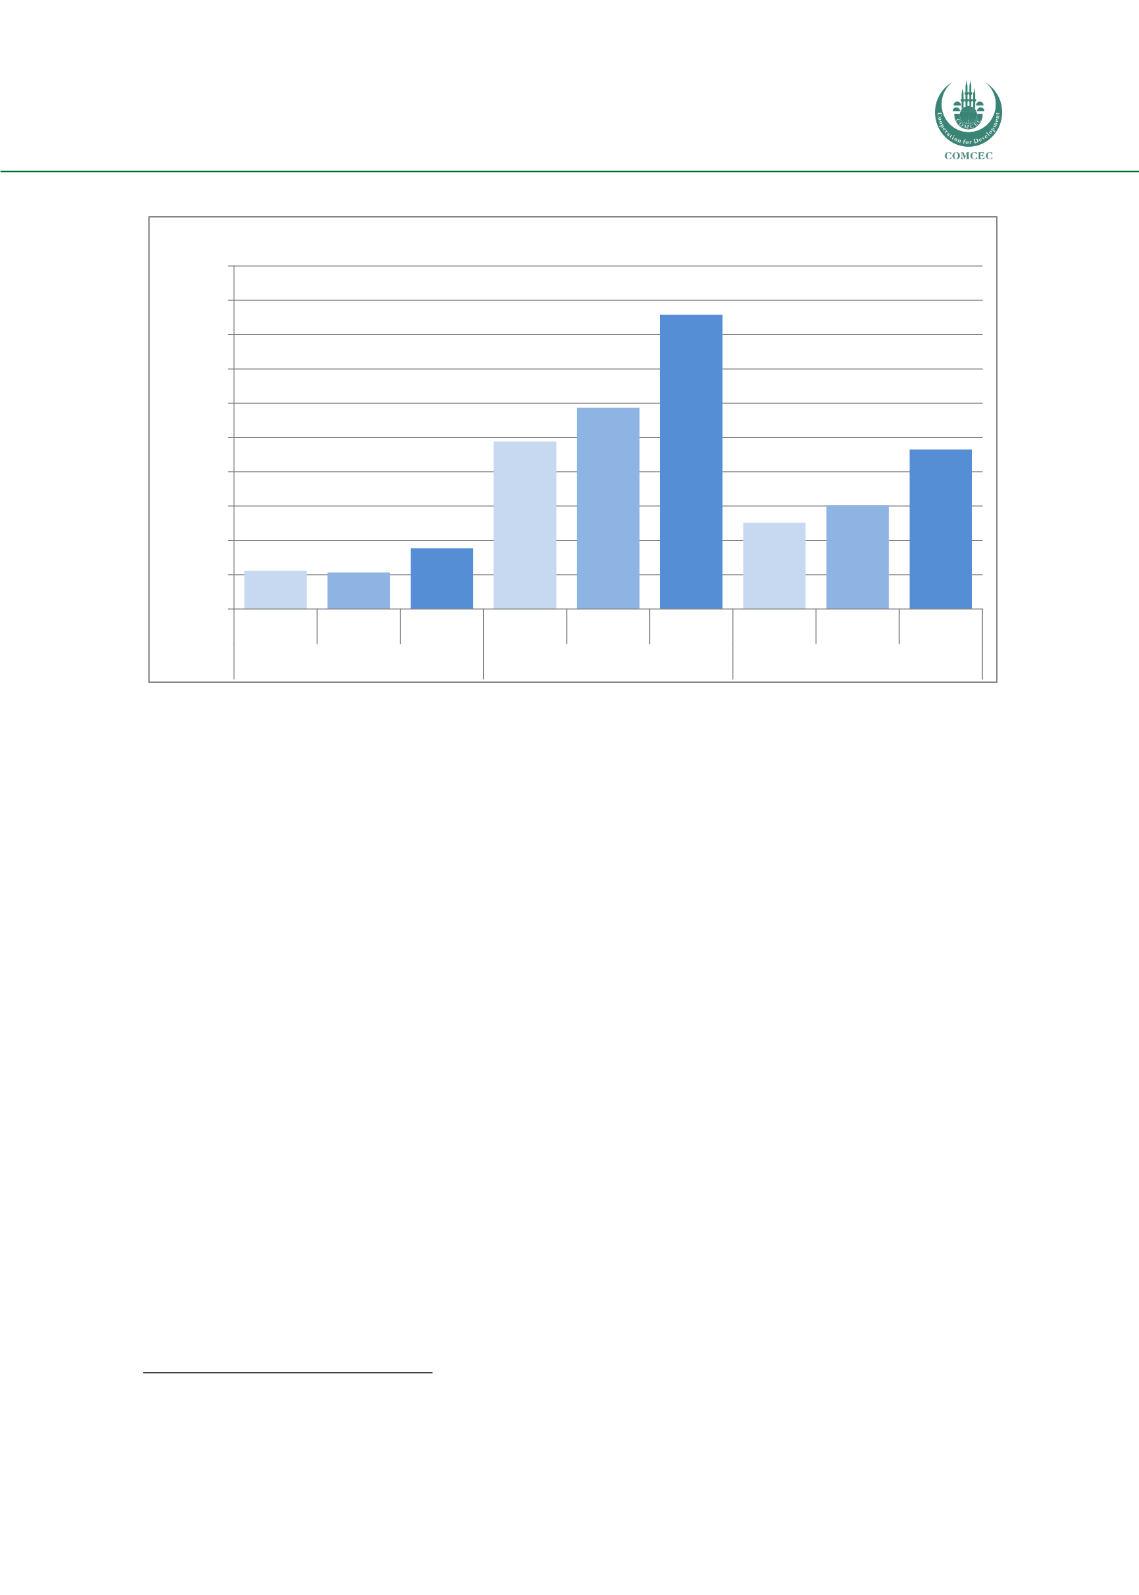
Figure 34. GDP Per Capita in the OIC Sub-Regions
Source: FAOSTAT
Food Prices
: Domestic food price index, which compares the relative price of food across
countries and over time, is another meaningful indicator to measure food accessibility of a
country and region.
According to FAO data, domestic food price index of the World has increased by 133 percent in
the period of 2000-2013.
17
In most of the OIC member countries, domestic food prices
increased substantially during the last decade and limited access to food especially of low
income people and deteriorated food security in the OIC. Particularly, Gambia, Guinea,
Mozambique, Nigeria, Sierra Leone and Uganda in the African Group; Egypt, Iraq, Syrian Arab
Republic, Yemen in the Arab Group; and Azerbaijan, Bangladesh, Brunei Darussalam,
Indonesia, Iran, Kazakhstan, Pakistan, Suriname in the Asian Group faced high rates of inflation
in domestic food prices (see Annex 34). The main reasons for increases in domestic food price
in the OIC member countries include instability in the Middle East and North Africa, the
climate change and the global food crisis which occurred in 2007-2008 and during 2011.
3.3.
Utilization
According to FAO definition, utilization refers to the act of food usage and consumption
through adequate diet, clean water, sanitation and health care to reach a state of nutritional
well-being where all physiological needs of individuals are met.
18
Therefore, the significance of
non-food inputs is mainly emphasized with respect to utilization aspects of food security.
Hence, general hygiene and sanitation, water quality, health care practices and food safety and
quality are considered as fundamental determinants of food utilization.
17
FAO, 2015b
18
FAO, 2006
2.232
2.123
3.540
9.773
11.745
17.154
5.030
6.052
9.294
0
2.000
4.000
6.000
8.000
10.000
12.000
14.000
16.000
18.000
20.000
1990
2000
2014
1990
2000
2014
1990
2000
2014
African Group
Arab Group
Asian Group
Dollar