


 43 / 101

COMCEC Agriculture Outlook 2017
33
of 2011-2013 period, Asian Group was followed by Arab Group and African Group with 200
and 183 dollars per capita respectively. The growth of average value of food production in
African and Arab Groups were below 10 percent.
Average Protein Supply
: In this study, the last indicator examined under the availability facet
of food security is average protein supply. Since the importance of proteins in human diets is
substantial and they are considered as the keystone of body organs, average protein intake of
people closely associated with sufficient and well-balanced nutrition. Therefore, average
protein supply per caput in a day is a useful indicator to measure the food security of a country
or region.
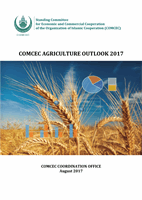
Figure 29. Average Protein Supply in the OIC and the World
Source: FAOSTAT
Figure 29 illustrates that average protein supply per caput in a day in the OIC member
countries reached to 70.2 gr/caput in 2009-2011; while, it was 62.2 gr/caput at the beginning
of 1990s. Compared to the world, it was 12.5 percent lower than world average, and almost 47
percent lower than the developed countries in the period of 2009-2011.
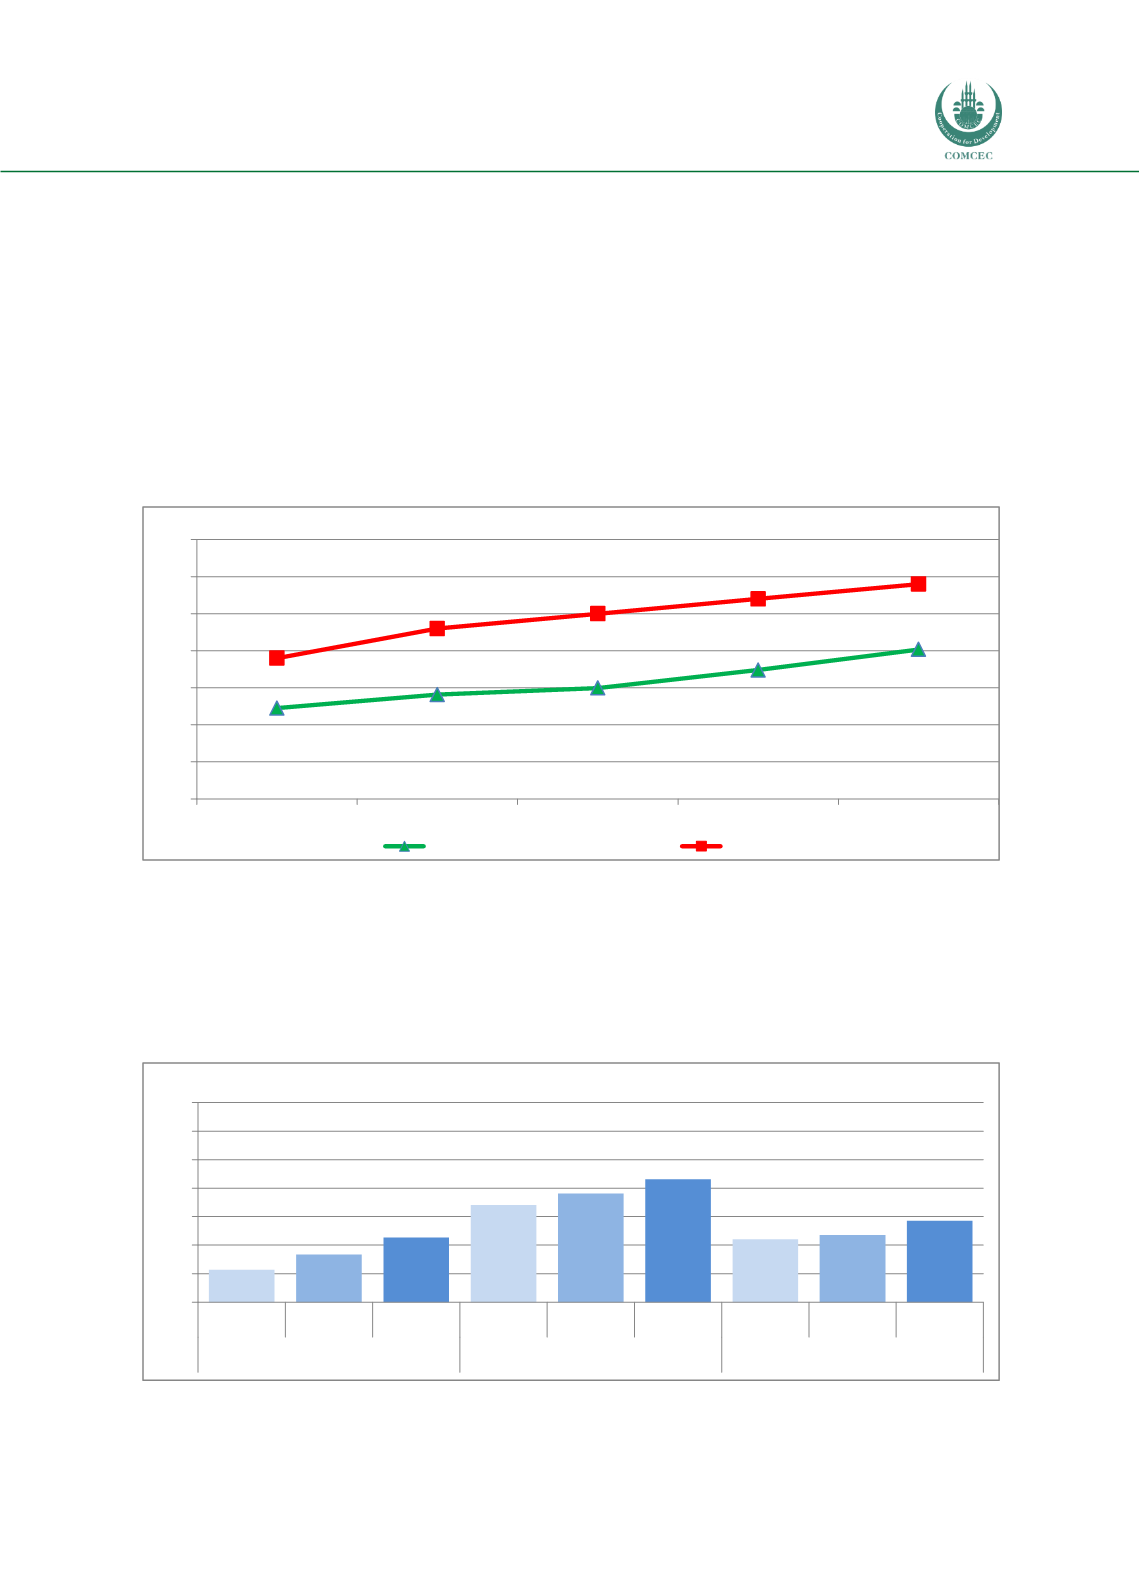
Figure 30. Average Protein Supply in the OIC Sub-Regions
Source: FAOSTAT
62,2
64,1
65,0
67,4
70,2
69,0
73,0
75,0
77,0
79,0
50
55
60
65
70
75
80
85
1990-92
1995-97
2000-02
2005-07
2009-11
gr/caput/day
OIC
World
51
57
63
74
78
83
62
64
69
40
50
60
70
80
90
100
110
1990-92 2000-02 2009-11 1990-92 2000-02 2009-11 1990-92 2000-02 2009-11
African Group
Arab Group
Asian Group
gr/caput/day