


 46 / 101

COMCEC Agriculture Outlook 2017
36
Two of the most important indicators of access are the average level of income and the
distribution of the income in a country. In this section we present two such indicators, namely
GDP Per Capita, Food Prices, and Calorie Consumption Distribution.
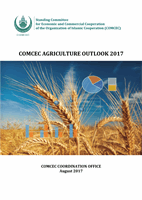
Figure 33. GDP Per Capita in the OIC and World
Source: FAOSTAT Note: GDP’s are deflated with PPP rates
GDP Per Capita
: Figure 33 demonstrates the developments in GDP per capita valued at
constant 2011 International Dollars using purchasing power parity rates in the OIC and World
and by using a weighted population averages. Therefore, this indicator provides information
on the possibility of economical access to markets taking into account the purchasing power of
regions. As it is seen in the figure, average GDP per capita of the OIC member countries reached
9,500 Int. Dollars, while it was 5,400 Int. Dollars in 1990s. Compared to the world, average
GDP per capita of the OIC member countries was far away from the world average, which was
almost 14,500 Int. Dollars in 2014. Nonetheless, 74 percent growth in the GDP per capita of the
OIC member countries in the period 1990-2014 was higher than the World’s average of 63
percent.
At the sub-regional level, average GDP per capita of Arab Group was the highest with 17,150
Int. Dollars in 2013. It was followed by Asian Group and African Group with 9,300 and 3,500
Int. Dollars, respectively.
5.413
5.811
6.386
7.347
8.550
9.436
8.875
9.177
10.311
11.668
13.182
14.463
2000
4000
6000
8000
10000
12000
14000
16000
1990
1995
2000
2005
2010
2014
Dollar
OIC
World