


 42 / 101

COMCEC Agriculture Outlook 2017
32
indicator to measure the availability aspects of food security. It is calculated in three year
averages, and expresses the food net production value, in constant 2004-06 international
dollar terms, per caput.
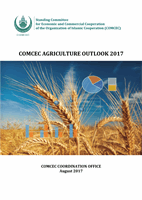
Figure 27. Average Value of Food Production in the OIC and the World
Source: FAOSTAT
Figure 27 shows the average value of food production from 1990-92 to 2011-13. As of 2011-
2013, average value of food production in the OIC member countries reached 223 dollars per
capita, from 182 dollars in 1990-1992. Between these periods, it has increased by 22 percent.
However, in 2011-2013 OIC average value of food production per caput was almost 40 percent
lower than the world.
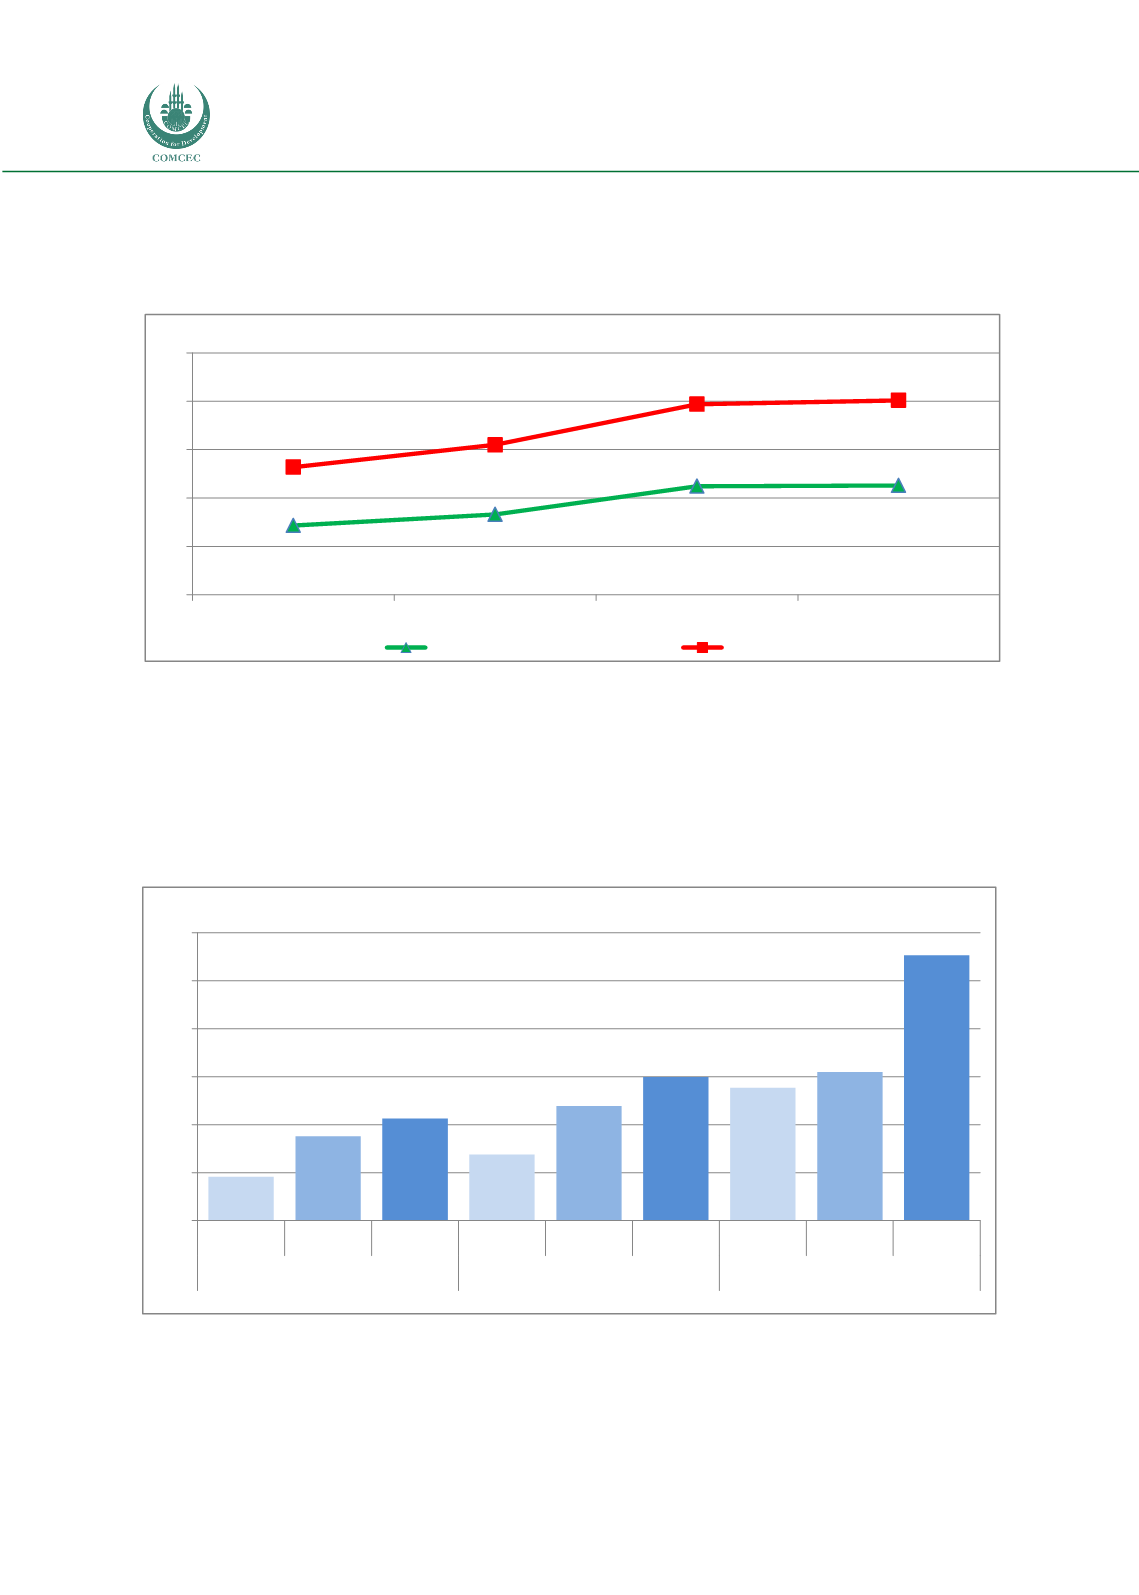
Figure 28. Average Value of Food Production in the OIC Sub-Regions
Source: FAOSTAT
At the sub-regional level, Asian Group has the highest average value of food production per
caput with 251 dollars, increasing by over 25 percentfrom from 195 dollarsin 1990-1992. As
181,7
193,1
222,2
223,0
242,0
265,0
307,0
311,0
110
160
210
260
310
360
1990-92
2000-02
2010-12
2011-13
Int. dollars/caput
OIC
World
158
175
183
167
188
200
195
202
251
140
160
180
200
220
240
260
1990-92 2000-02 2011-13 1990-92 2000-02 2011-13 1990-92 2000-02 2011-13
African Group
Arab Group
Asian Group
Int. dollars/caput