


 15 / 101

COMCEC Agriculture Outlook 2017
5
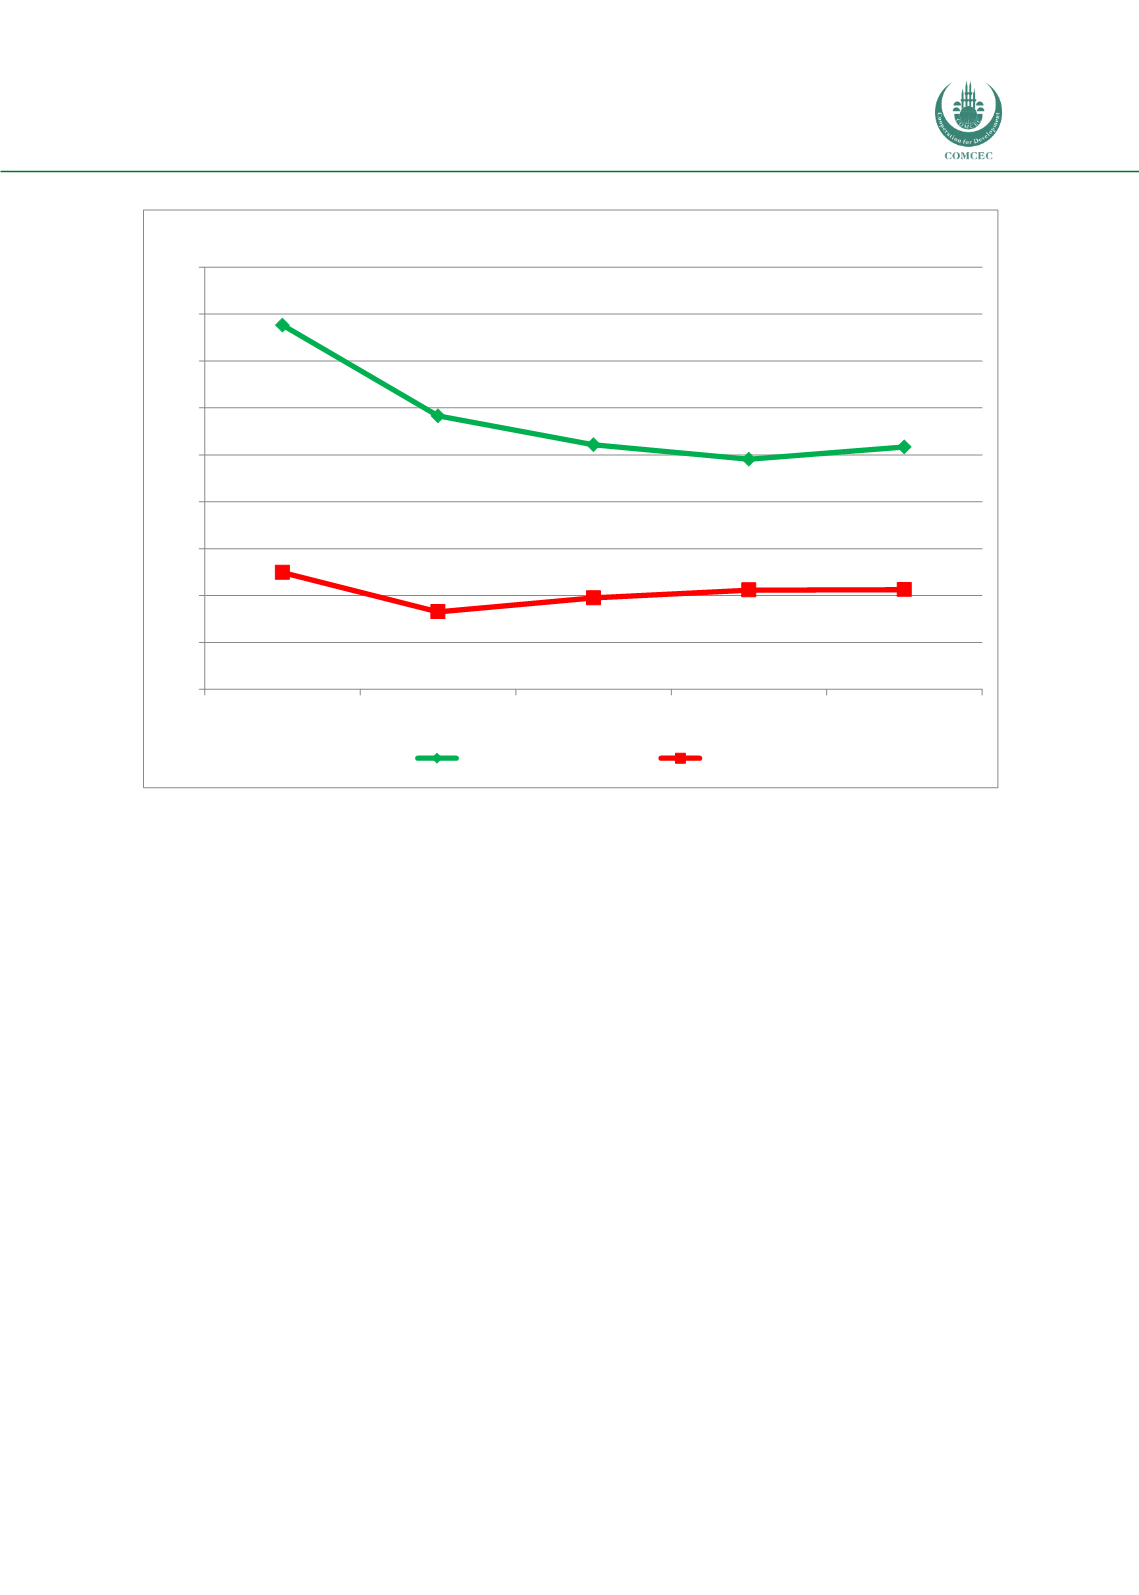
Figure 3. Share of Agricultural GDP in the OIC and World
Source: Annexes 2-6
During the last decades, agriculture activity in most of the OIC member countries has gradually
been replaced by services and industrial activity leading to decrease in the share of agriculture
sector of OIC member countries to their total GDP.
Figure 3 illustrates that at the beginning of 90s, the share of agricultural sector in OIC member
countries’’ total GDP was around 16 percent, dramatically declined to 10 percent in the
following decade. From 2000s to now, the decrease in the share of agricultural sector in OIC
member countries’ total GDP continued at a lower rate. As of 2015, it declined to 10 percent
which is more than two times higher than the share of agriculture in the world’s total GDP.
This demonstrates a progressive converging to the world wide low level share of agricultural
contribution to the GDP.
15,5
11,7
10,4
9,8
10,3
4,98
3,31
3,90
4,23
4,25
0
2
4
6
8
10
12
14
16
18
1990
2000
2010
2014
2015
Percentage
OIC
World