


 15 / 107

4
COMCEC Agriculture Outlook 2019
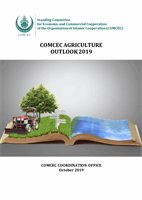
Figure 2 Agricultural GDP by Sub-Regions and their Share by Current Price
Source: Annexes 2-6
During the last decades, agriculture activity inmost of the OIC member countries has gradually
been replaced by services and industrial activity leading to decrease in the share of agriculture
sector of OICmember countries to their total GDP.
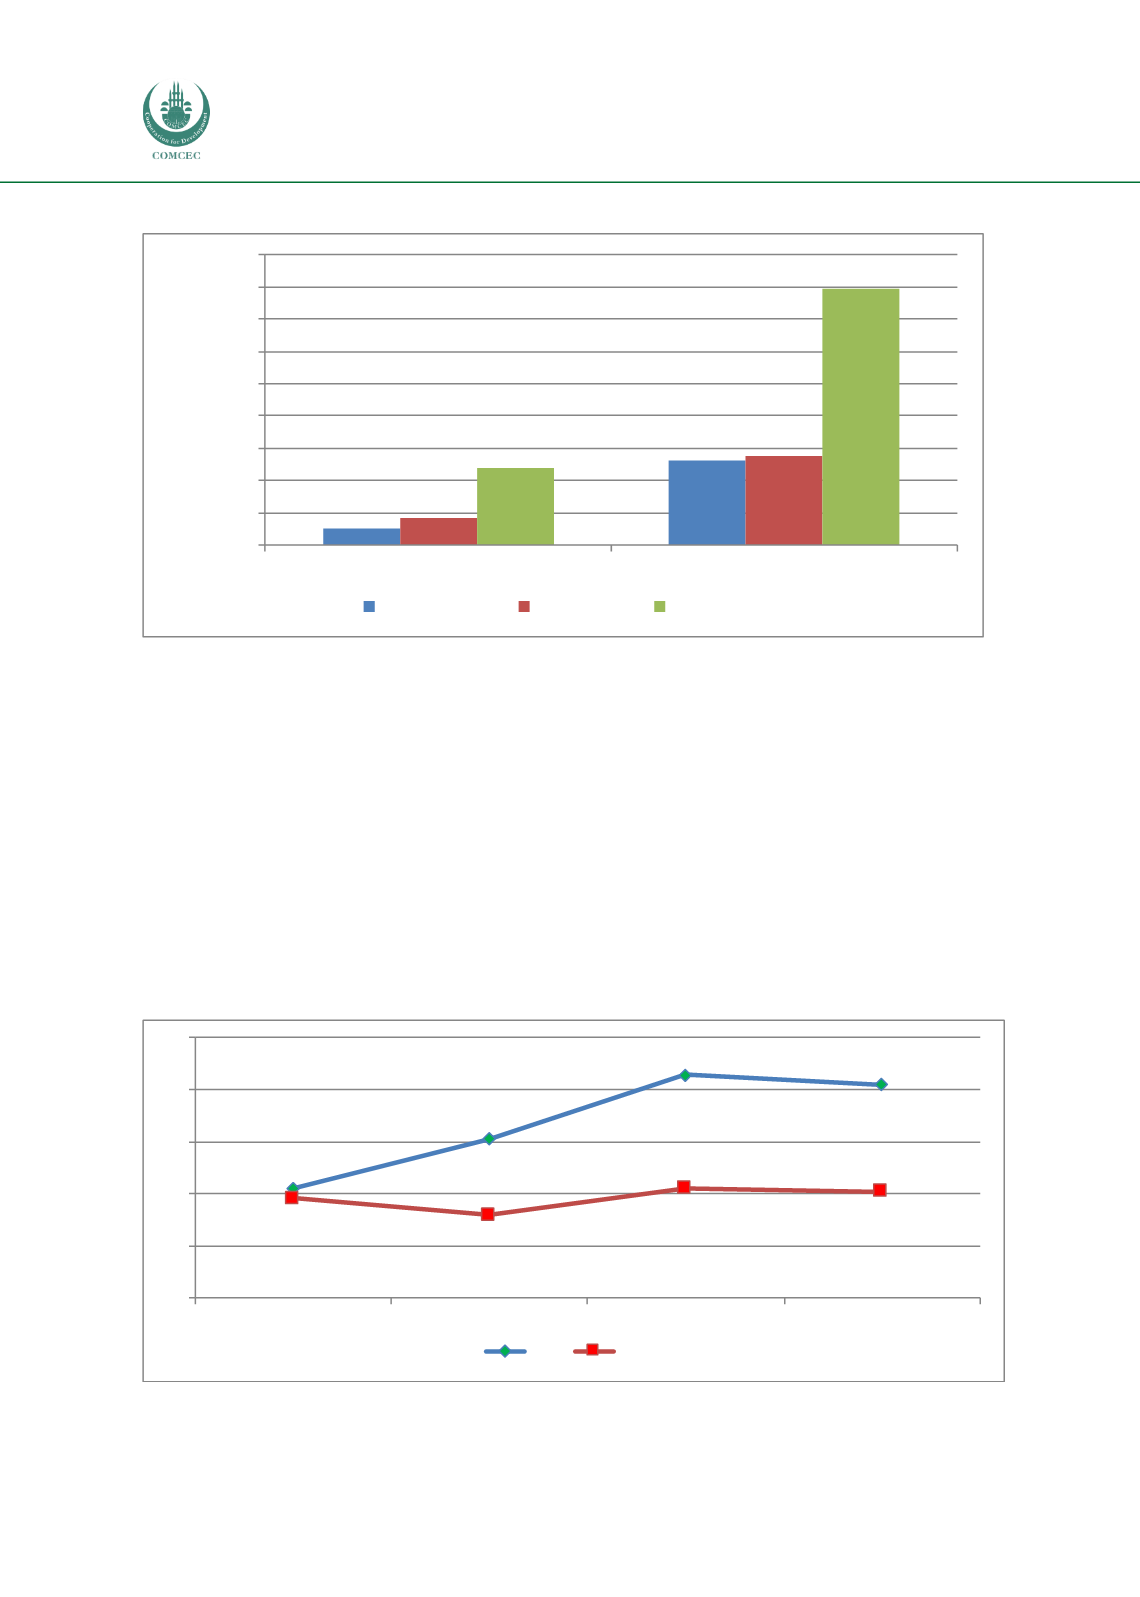
Figure 3 illustrates that at 1995, the share of agricultural sector in OICmember countries’ total
GDP was around 4.2 percent, increased to 6.11 percent in the following decade. From 2005 to
2015, the increase in the share of agricultural sector in OIC member countries’ total GDP
accelerated from 6.11 to 8.57. As of 2017, it declined to 8.18 percent which is more than two
times higher than the share of agriculture in the world’s total GDP. This demonstrates a
progressive converging to the world wide low level share of agricultural contribution to the
GDP.
Figure 3 Share of Agricultural GDP in the OIC and World
Source: Annexes 2-6
0
50
100
150
200
250
300
350
400
450
1995
2017
Billion Dollars
African Group Arab Group Asian Group
13.95
19.59
22.48
20.82
63.57
59.58
4.2
6.11
8.57
8.18
3.83
3.18
4.20
4.08
0
2
4
6
8
10
1995
2005
2015
2017
OIC
World
%