


 14 / 107

3
COMCEC Agriculture Outlook 2019
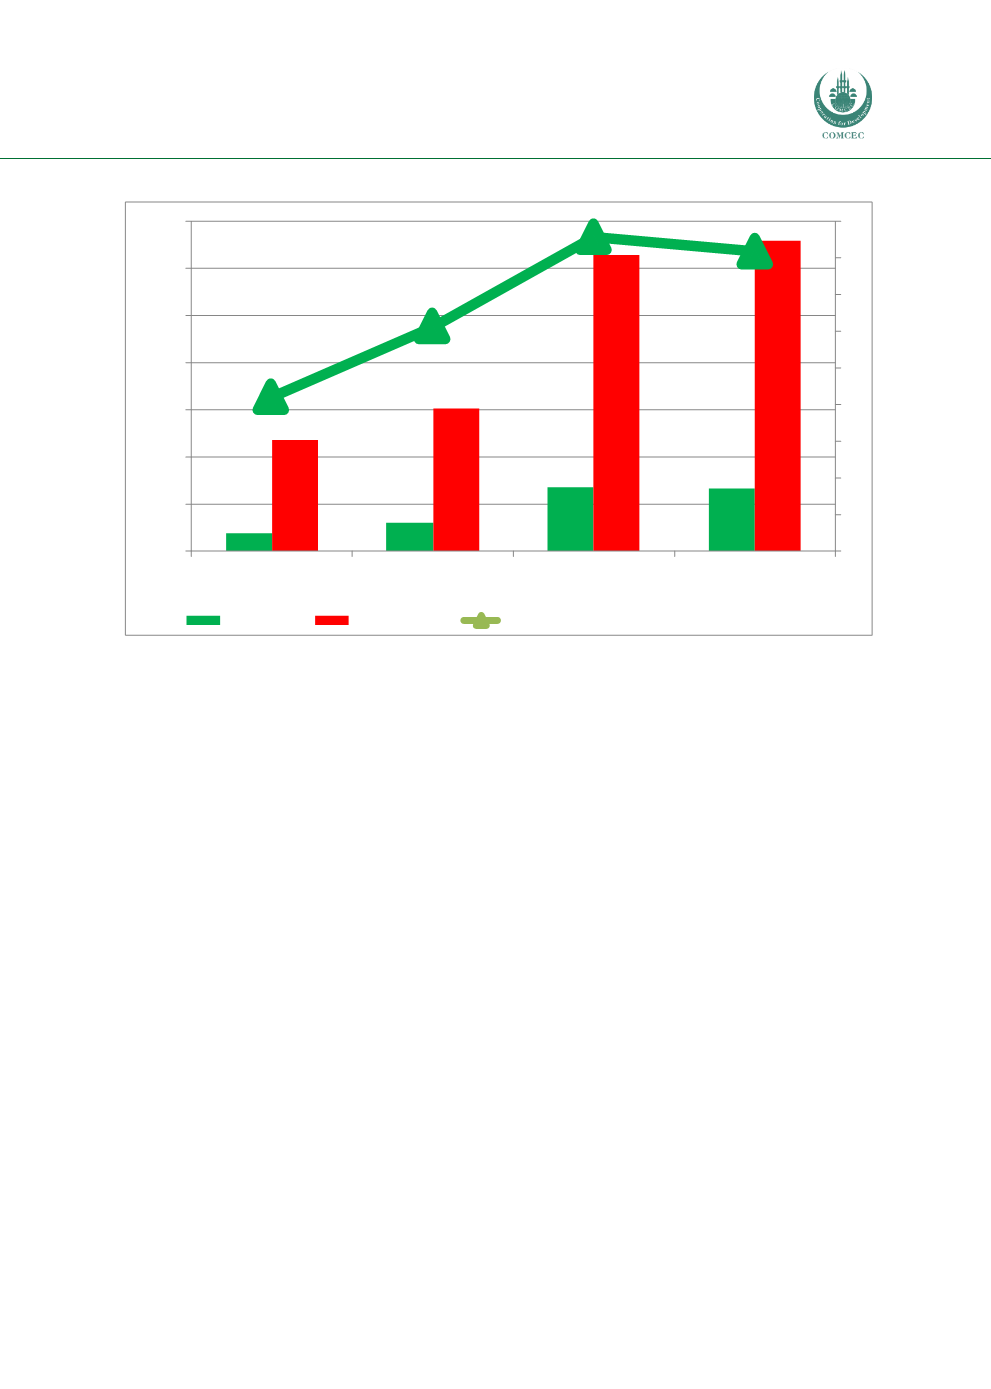
Figure 1 OIC Agricultural GDP and its Share in the World
Source: Annexes 2-6
The values of agricultural production in the OIC member countries have increased in the last
decades due to increases in production as well as higher prices. Figure 1 shows agricultural
sector’s contribution to GDP and its share in the world’s agricultural production. In 1995, OIC
agricultural GDP was 188 billion US Dollars with a share of 15.91 percent in the world’s
agricultural production. In 2017, OIC agricultural GDP reached 666 billion US Dollars with a
share of 20.18 percent in theworld’s agricultural production. This figure is important because
it shows the increasing importance of OIC agriculture in the world. However, OIC member
countries have a relatively lower performance in agriculture sector since, according to FAO,
OIC member countries own 29 percent of total world agricultural area as of 2017. Therefore,
the potential of agricultural sector in OIC member countries could be more effective ly utilized
to increase their share in world agricultural output.
The OIC member countries are classified into 3 groups as African, Arab and Asian group. The
contribution to these groups to the OIC total agricultural value added varies considerable, and
it shows an uneven pattern over time. The relative performance of African Group is getting
strong compared to the Arab and Asian Groups in the period of 1995-2017. However, Asian
Group has the highest contribution to agricultural production over the years.
As of 2017, OIC agricultural GDP reached to666,404.15million US Dollars and the contribution
of Asian group to this value is 397,035.31million US Dollars which ismore than half of the total
agricultural GDP of the OIC Member Countries. Hence, Asian Group has the highest amount of
the agricultural GDP, and followed by African Group and Arab Group with almost 130,567.81m
and 138,801.03 m US Dollars, respectively. From 1995 to 2017, the share of African group
agricultural GDP in OIC agricultural GDP increased to 19.59 percent from 13.95 percent. On the
other hand, the share of Arab Group agricultural GDP in OIC agricultural GDP stayed around
22.48 to 20.82 percent in the same period.
188
298
681
666
1181
1511
3148
3301
15.91
19.72
21.63
20.18
0
1
2
3
4
5
6
7
8
9
0
500
1000
1500
2000
2500
3000
3500
1995
2005
2015
2017
OIC Total
World Total
Share of OIC Agricultural GDP in the World
Billion Dollar
Percent