


 32 / 103

COMCEC Agriculture Outlook 2018
21
and the World realized between the period 1995 and 2010, can be explained by dramatic
increases in real agricultural values added, while arable land areas remained almost the same.
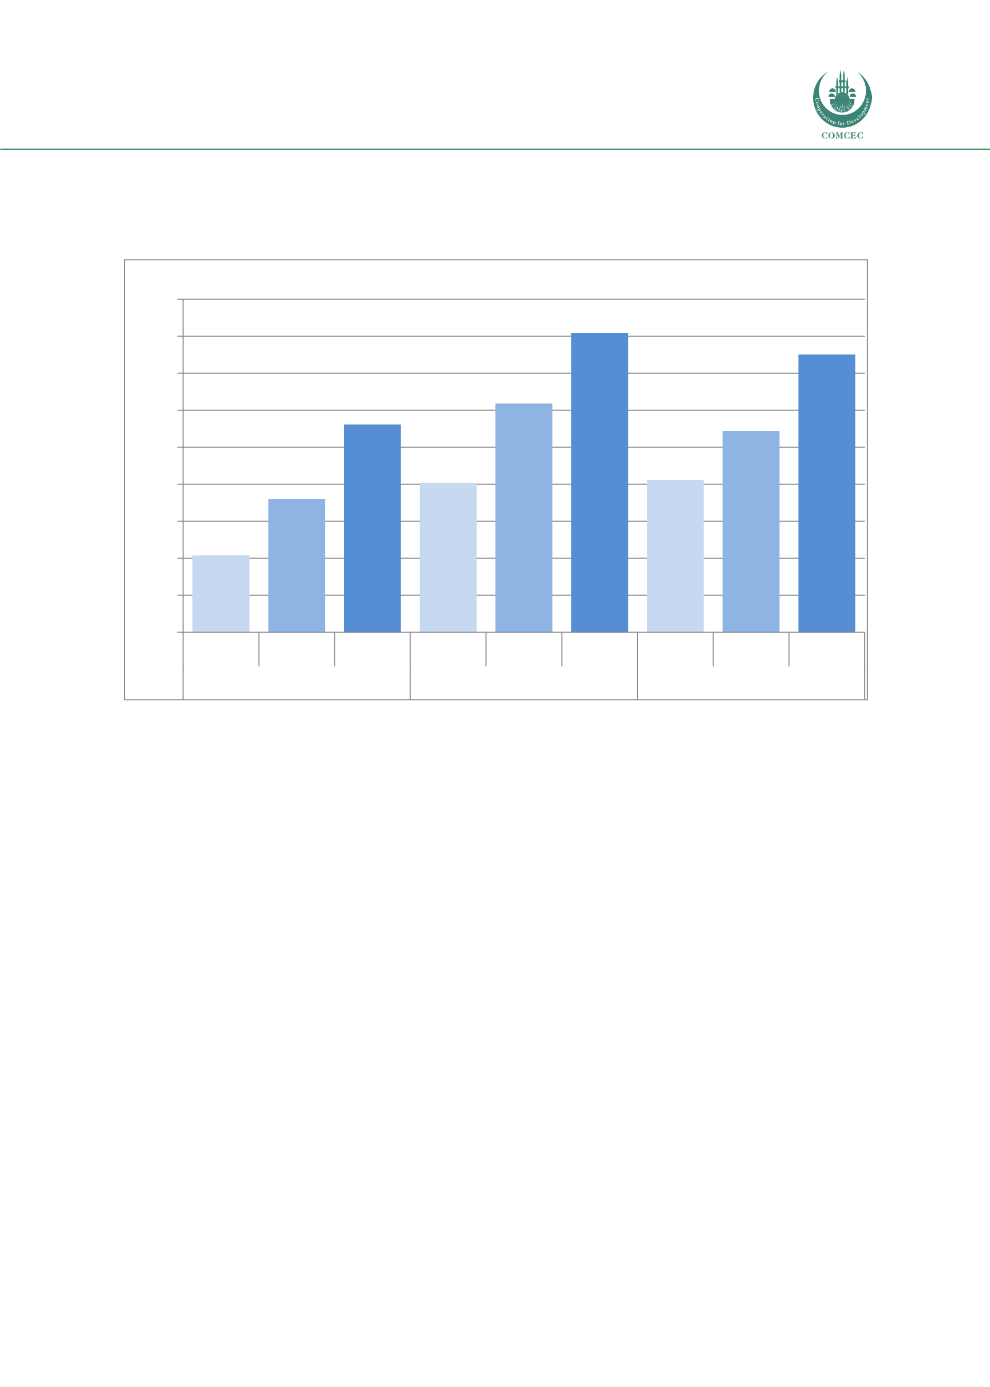
Figure 15. Land Productivity in the OIC by Sub-Regions
(Agr. GDP at 2005 constant prices)
Source: FAOSTAT
At the sub-regional level, Arab Group had the highest level of agricultural land productivity in
the OIC with 1,617 US Dollars per hectare in 2015. The low level of arable land in the Arab Group
(one third of Asian Group and half of African Group), results in its land productivity to be highest,
even though its agricultural GDP is the lowest among the OIC sub-regions. The Arab Group was
followed by Asian Group with 1,502 US Dollars per hectare in 2015. Among the three sub-
regions, African Group had the lowest level of agricultural land productivity during the period
1995-2015. On the other hand, although African Group had the lowest performance with respect
to agricultural land productivity over the years; it accomplished the highest growth in the same
period, with more than 2 times increase in the level of agricultural land productivity (Figure 15).
2.3.2.
Labor Productivity
Agricultural labor productivity is measured by the ratio of total agricultural value added to the
number of agricultural employment. Hence, it tells the average performance of total labor
employed in agriculture sector. Figure 16 shows the agricultural labor productivity in the OIC
and in the World between 2000 and 2015 using real agricultural GDP at 2005 prices as the
measure of agricultural value added.
417
720
1.123
808
1.237
1.617
823
1.088
1.502
0
200
400
600
800
1.000
1.200
1.400
1.600
1.800
1995 2005 2015 1995 2005 2015 1995 2005 2015
African Group
Arab Group
Asian Group
Dollar/ha