


 28 / 103

COMCEC Agriculture Outlook 2018
17
which share OIC’s total arable land with 9.9 percent, 9.6 percent, 7.7 percent, and 6.7 percent,
respectively. Nonetheless, most of the OIC member countries’ agricultural area mainly consists
of permanent meadows and pastures. (Annex 17).
2.2.
Productions
The OIC member countries pursue a wide range of crop and livestock production systems as
they are on different agro-ecological zones, have different agricultural infrastructures,
production and consumption habits. Hence, a large variety of agricultural products are grown in
the OIC.
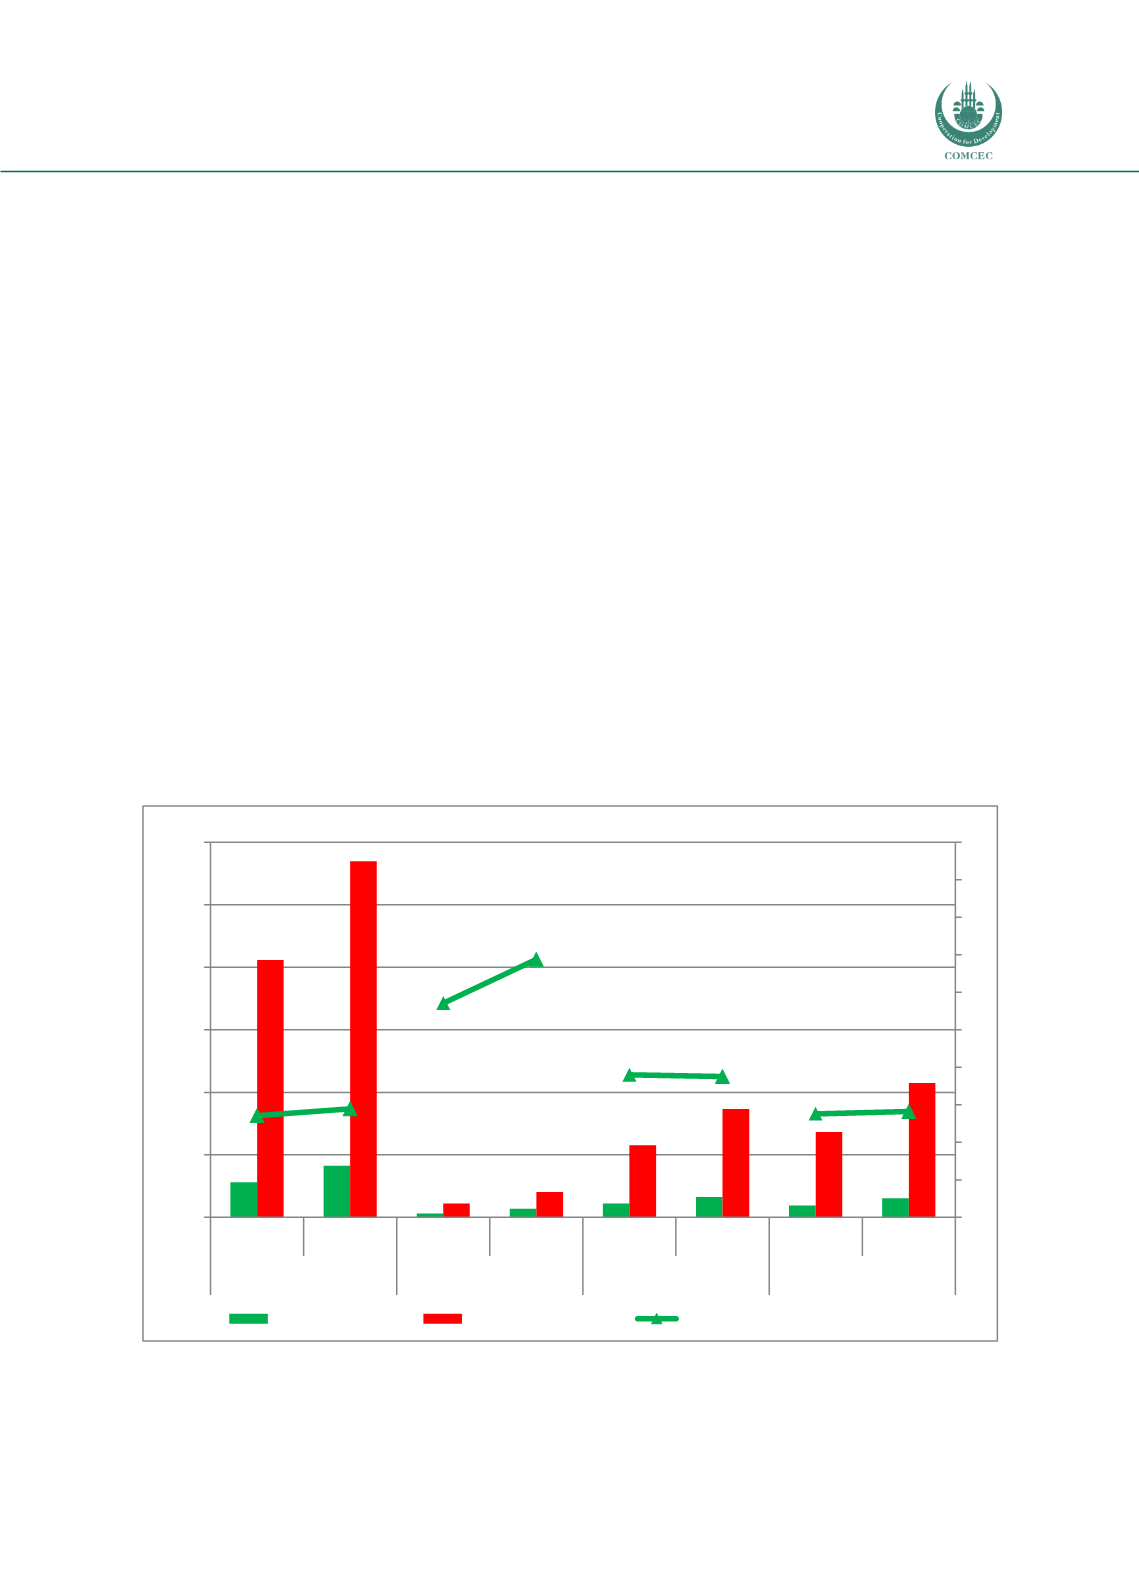
Figure 11 shows that in terms of the volume of agriculture production, as of 2016, OIC member
countries contributed 411 million tons to the world cereal production, representing 14.5
percent of the world total cereals production. Even though the cereal production increased by
more than 40 percent in the period of 2000-2016, the share of OIC member countries in the
world cereal production showed a very slight increase. As of 2014, 70 million tons of oil crops
were produced in the OIC, compared to 31 million tons in 2000. This substantial amount of oil
crops production in the OIC also stimulated the share of OIC member countries in the world oil
crops production, which increased from 28.6 percent to 34.4 percent during the 2000-2014
period. Among the commodity groups in the OIC, oil crops have the highest share in the world
with an increasing trend.
Figure 11. Crop Productions in the OIC and Shares in the World
Source: FAOSTAT
279
412
31
70
109
163
94
152
2.059
2.849
110
204
576
866
682
1.075
13,6
14,5
28,6
34,4
19,0
18,8
13,8
14,1
0
5
10
15
20
25
30
35
40
45
50
0
500
1.000
1.500
2.000
2.500
3.000
2000
2016
2000
2014
2000
2016
2000
2016
Cereal
Oilcrops
Fruit
Vegetable
Million Tons
Percentage
OIC (Left Axis)
World (Left Axis)
OIC Share in the World (Right Axis)