


 24 / 103

COMCEC Agriculture Outlook 2018
13
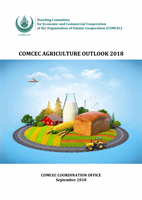
Figure 9. OIC Agricultural Trade Performance of OIC Member Countries in the World
Source: Annex 12 and 13
At the sub-regional level, Asian Group had the highest share in OIC’s agricultural exports with
68.7 percent in 2017. Asian Group was followed by Arab and African Groups with 20.1 percent
and 11.2 percent respectively. In terms of agricultural imports, Arab Group accounted for 49.5
percent of the OIC’s total in the same period. It was followed by Asian and African Groups with
42.5 percent and 8 percent, respectively (Figure 10).
The Annexes 15 and 16 illustrate the first 15 partner countries and products in the OIC’s regional
level exports and imports. The African Groups countries have trade networks with partner
countries in the other regions with lowest intra-OIC trade share in its agricultural exports, 8.8
percent while the Arab Group and Asian Group countries has an intra-OIC trade share of 40.4
and 8.7 percent respectively. The Asian Group Countries also have a higher share of its own
regional export of 36.1 percent. The same is true for the case of OIC’s imports.
The product group of cereals is the top item in OIC’s imports of different regional group of
countries following by dairy and meat products. The OIC Regions have their regional specialty
items as top export items, namely, cocoa for African, nuts for Arab and edible oils for Asian
Countries.
5,75
7,47
9,62
9,03
9,04
8,60
8,17
8,65
11,67
13,49
13,46
12,80
0
2
4
6
8
10
12
14
16
18
20
2001
2005
2010
2015
2016
2017
Percentage
Share of OIC Agr. Exports in the World
Share of OIC Agr. Imports in the World