


 30 / 94

Financial Outlook of the OIC Member Countries 2017
18
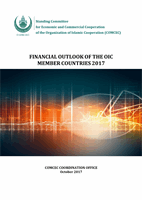
Figure 15: Stock Market Capitalization to GDP (%)
Source: Authors’ calculation from the World Bank Database
Another indicator to measure the development in stock market is used as
stock value traded
,
which refers to total value of all traded shares in a stock market exchange as a percentage of
GDP. In addition to the stock market capitalization which simply presents value of listed
shares, this indicator incorporates information on the size and activity of the stock market. As
indicated by Chak, Demirgüç-Kunt (2012), trading of ownership claims on firms in an economy
is closely tied to the rate of economic development.
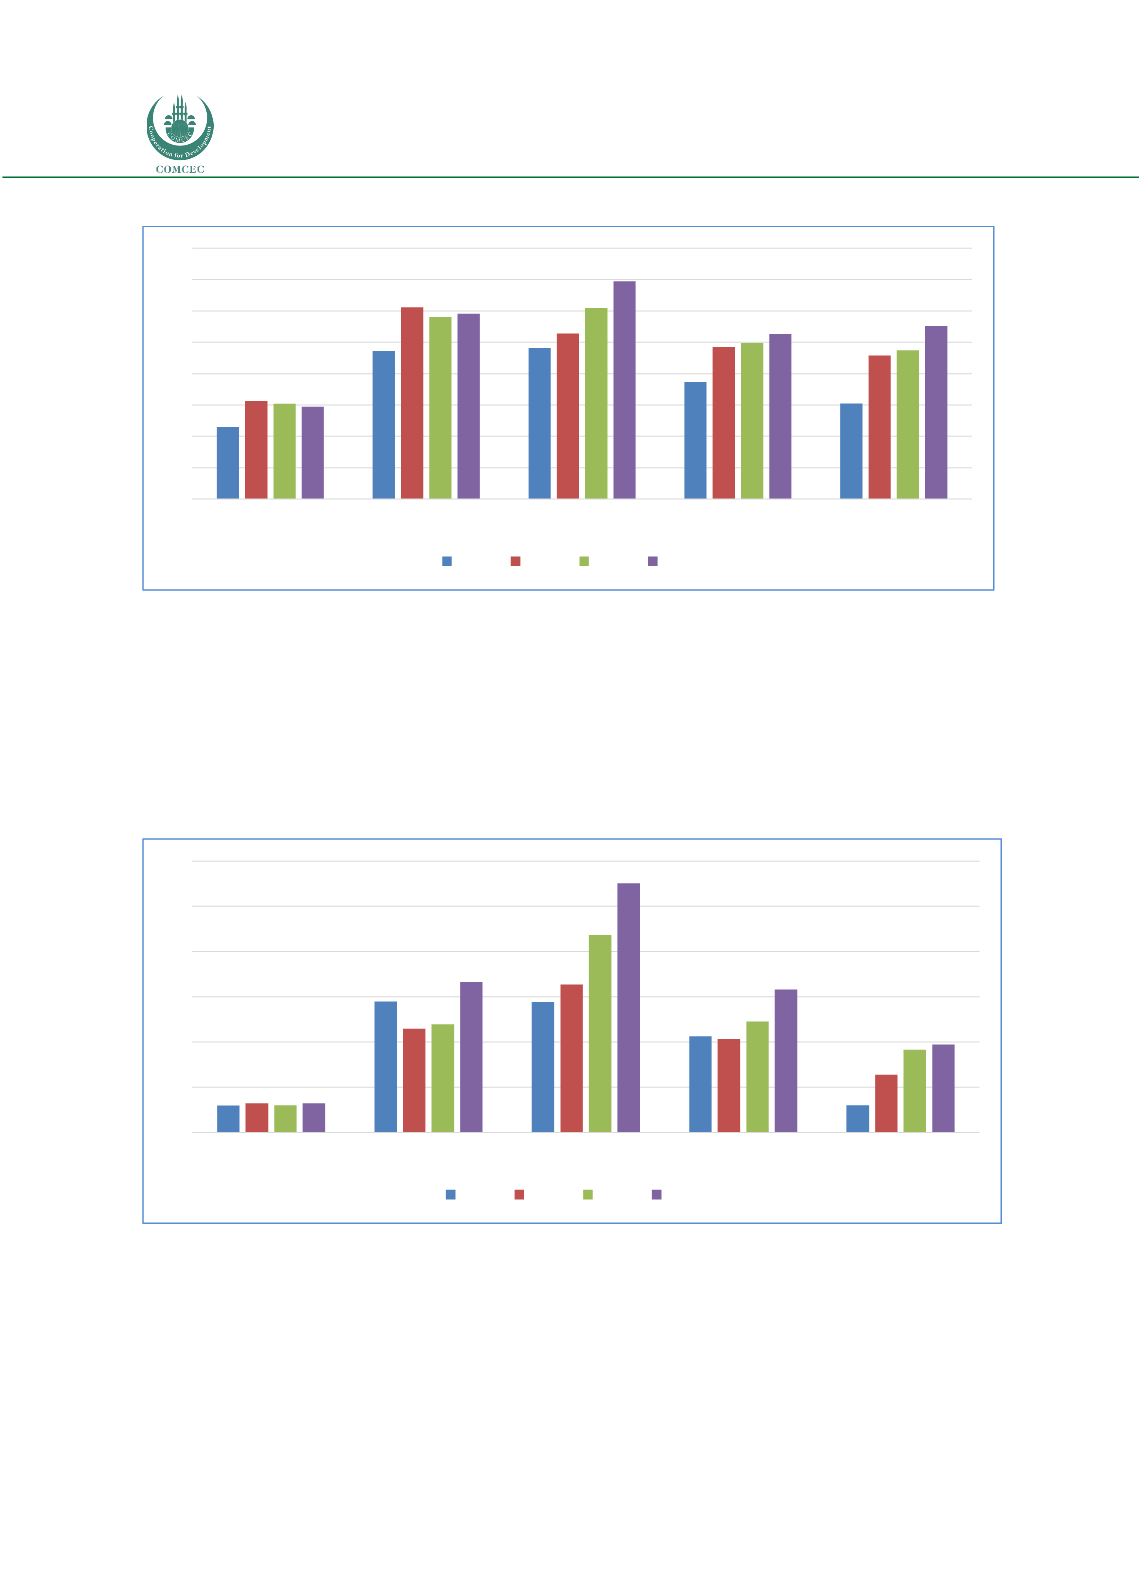
Figure 16: Stock Market Total Value Traded to GDP (%)
Source: Authors’ calculation from the World Bank Database
Although there are substantial variations across countries, the world average showed a
significant improvement in recent years and reached to 9.7% in 2015. Over this period, the OIC
average exceeded the world average in every year and realized as 15.8% in 2015. Similar to
the stock market capitalization, there is no data for the Low-Income group countries.
0
10
20
30
40
50
60
70
80
OIC-LMIG
OIC-UMIG
OIC-HIG
OIC-Average
World Average
2012 2013 2014 2015
0
5
10
15
20
25
30
OIC-LMIG
OIC-UMIG
OIC-HIG
OIC-Average
World Average
2012 2013 2014 2015