
Malnutrition in the OIC Member
Countries: A Trap for Poverty
COMCEC
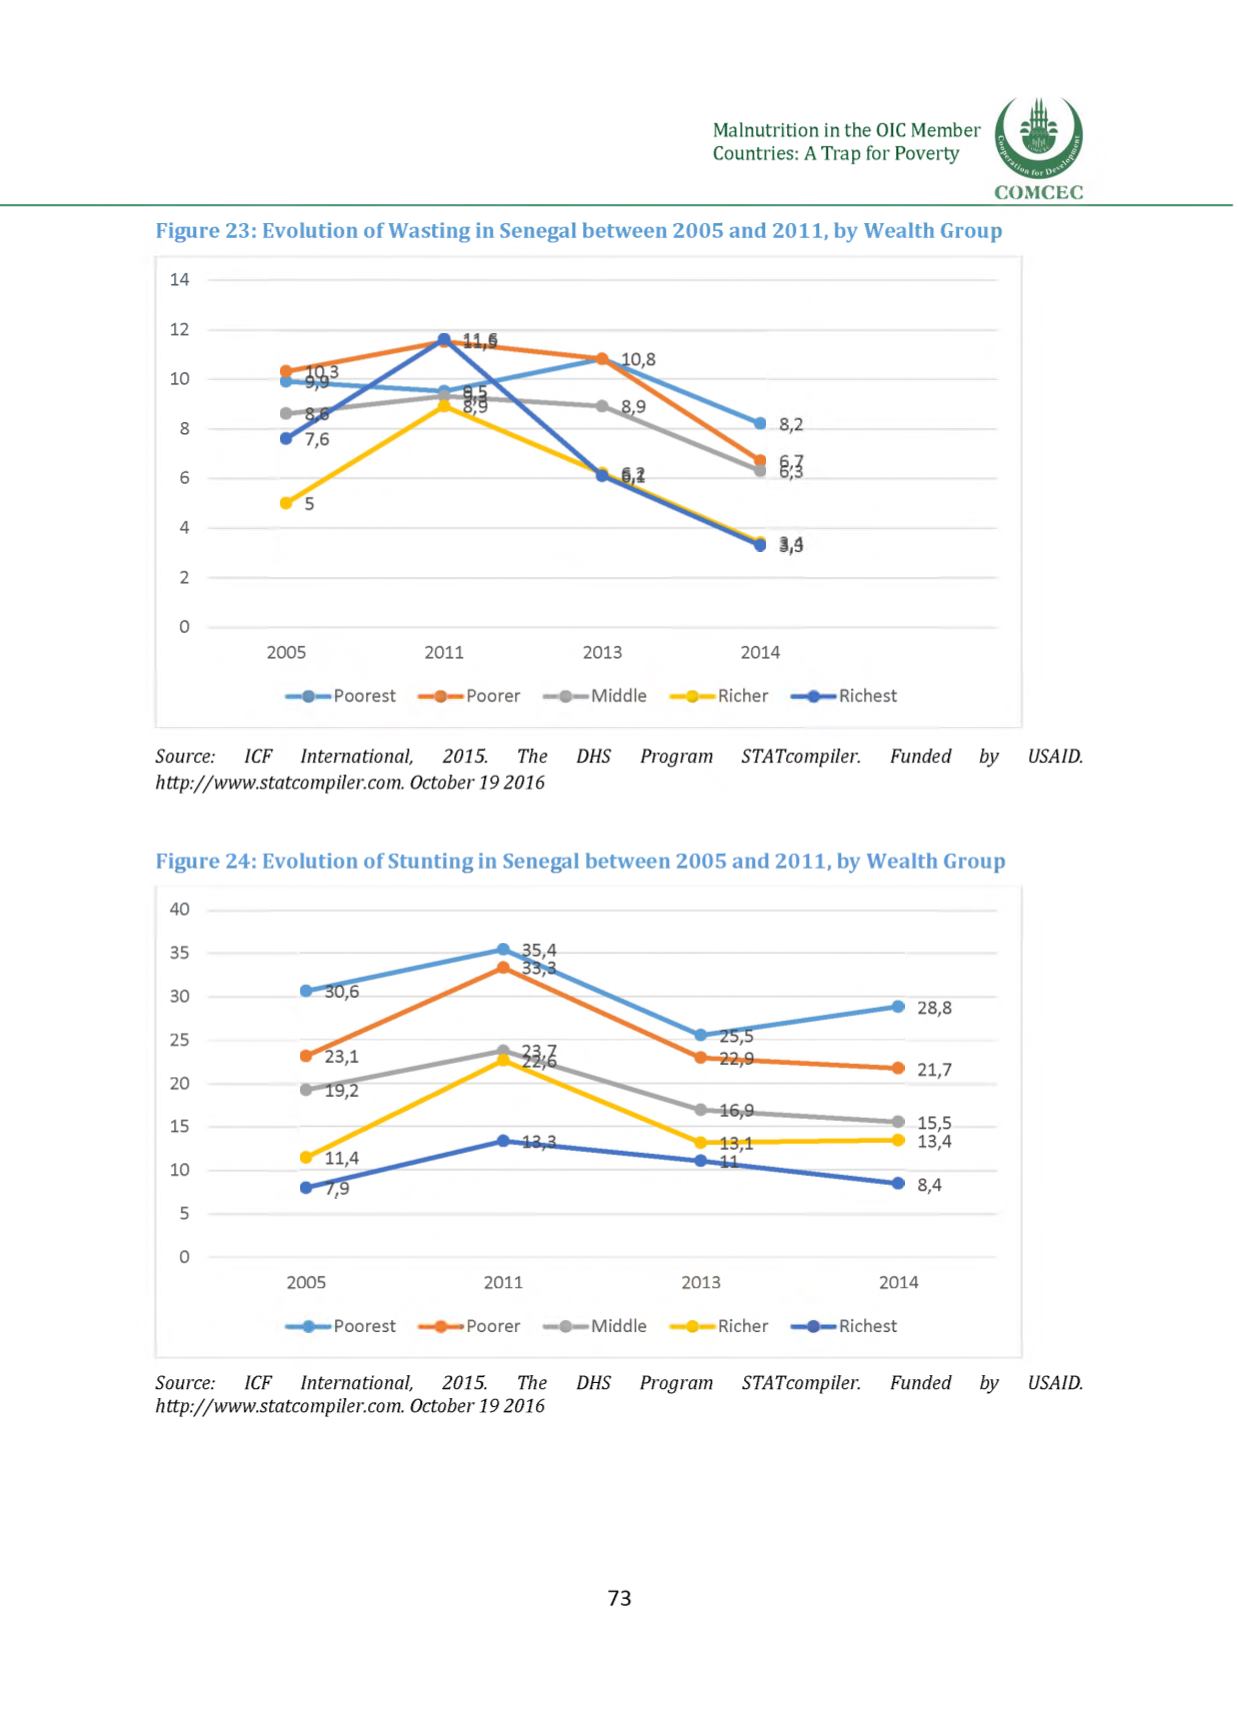
Figure 23: Evolution ofWasting in Senegal between 2005 and 2011, by Wealth Group
14
12
10
8
6
4
2
0
2005
2011
2013
2014
9
Poorest
9
Poorer
9
Middle
9
Richer
Richest
Source:
ICF International,
2015.
The
DHS
Program
STATcompiler.
Funded by
USAID.
http://www.statcompiler.com.October 19 2016
Figure 24: Evolution of Stunting in Senegal between 2005 and 2011, by Wealth Group
40
35
30
25
20
15
10
5
0
2005
28,8
21,7
15,5
13.4
8.4
Poorest
2011
2013
2014
»Poorer
9
Middle
< Richer
» Richest
Source:
ICF International,
2015.
The
DHS
Program
STATcompiler.
Funded by
USAID.
http://www.statcompiler.com.October 19 2016
73


