
Malnutrition in the OIC Member
Countries: A Trap for Poverty
COMCEC
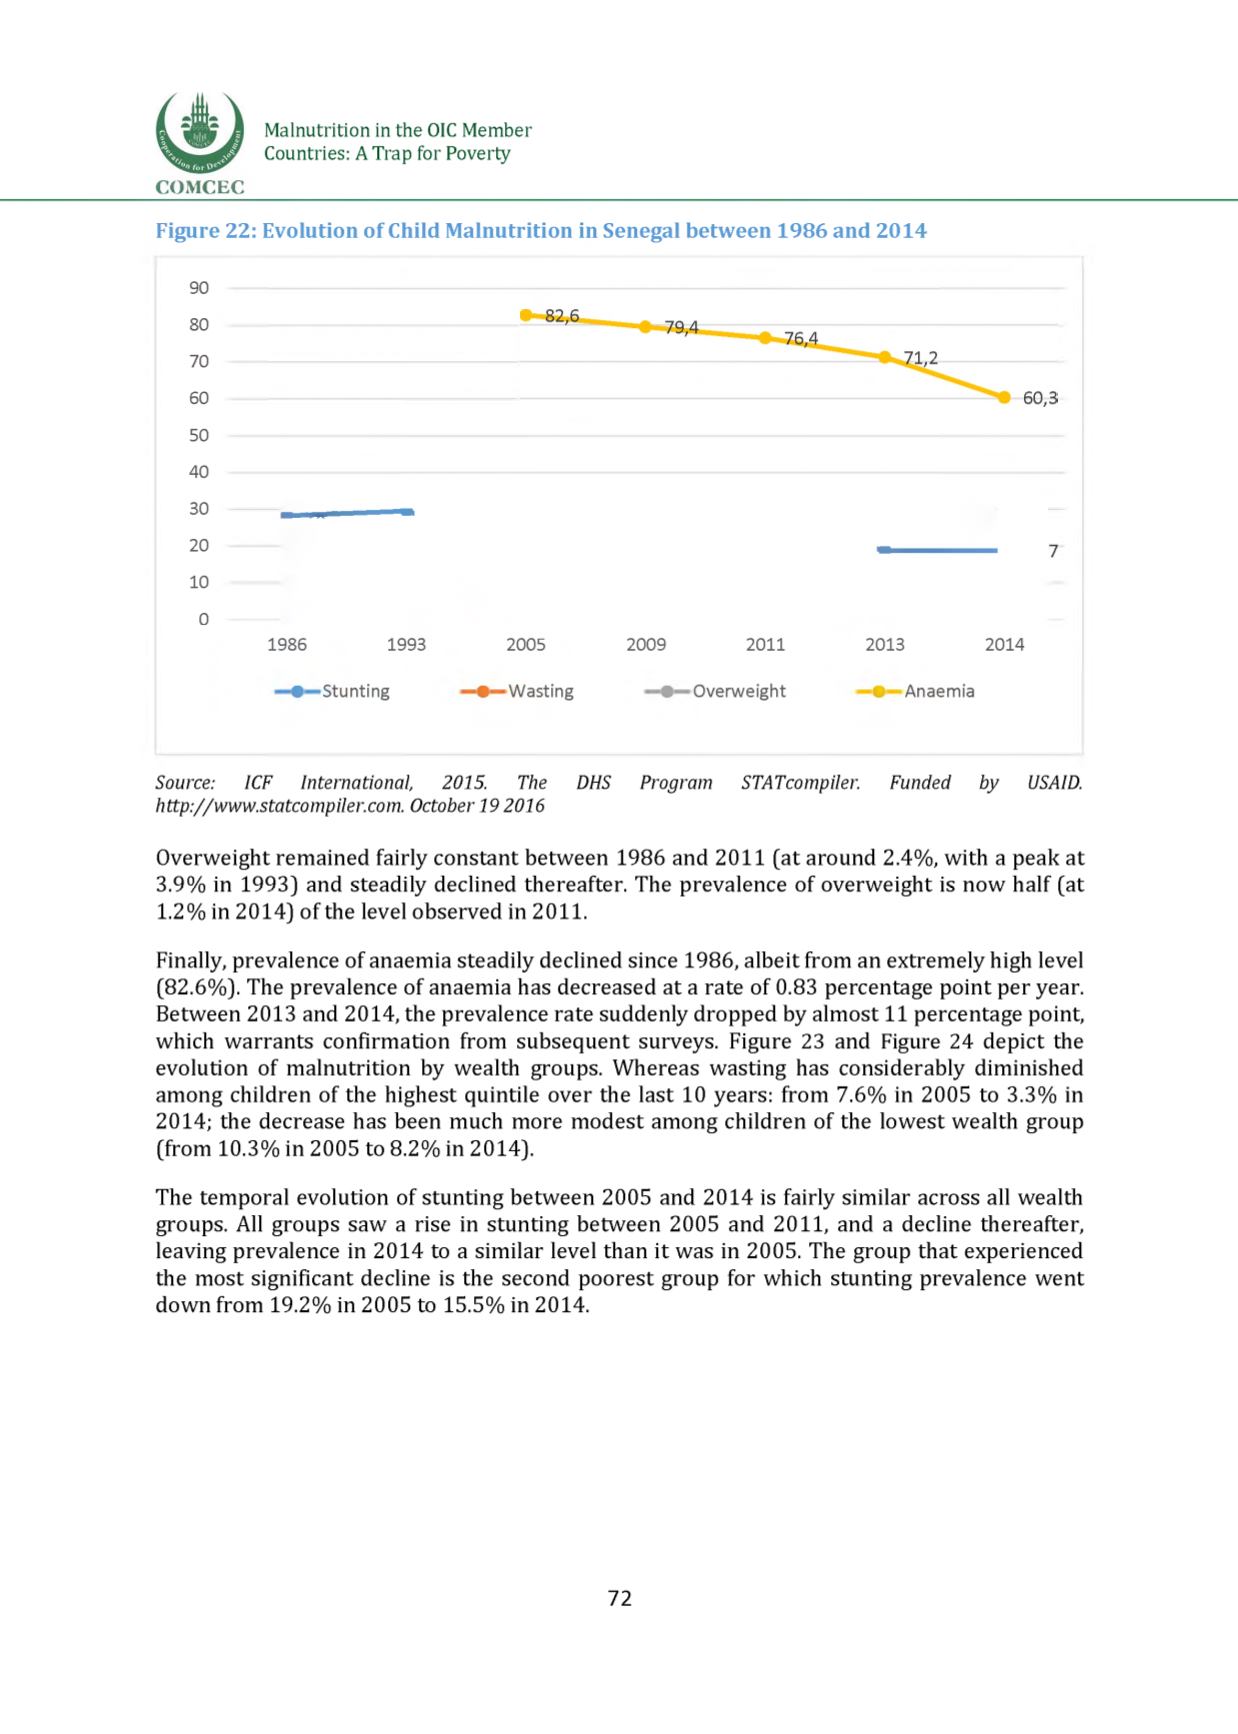
Figure 22: Evolution of Child Malnutrition in Senegal between 1986 and 2014
90
80
70
60
50
40
30
20
10
0
• 18,7
1986
1993
2005
9
Stunting
9
Wasting
2009
2011
9
Overweight
2013
2014
9
Anaemia
Source:
ICF International, 2015.
The
DHS
Program
STATcompiler.
Funded by
USAID.
http://www.statcompiler.com.October 19 2016
Overweight remained fairly constant between 1986 and 2011 (at around 2.4%, with a peak at
3.9% in 1993) and steadily declined thereafter. The prevalence of overweight is now half (at
1.2% in 2014) of the level observed in 2011.
Finally, prevalence of anaemia steadily declined since 1986, albeit from an extremely high level
(82.6%). The prevalence of anaemia has decreased at a rate of 0.83 percentage point per year.
Between 2013 and 2014, the prevalence rate suddenly dropped by almost 11 percentage point,
which warrants confirmation from subsequent surveys
. Figure 23 an
d Figure 24 depict the
evolution of malnutrition by wealth groups. Whereas wasting has considerably diminished
among children of the highest quintile over the last 10 years: from 7.6% in 2005 to 3.3% in
2014; the decrease has been much more modest among children of the lowest wealth group
(from 10.3% in 2005 to 8.2% in 2014).
The temporal evolution of stunting between 2005 and 2014 is fairly similar across all wealth
groups. All groups saw a rise in stunting between 2005 and 2011, and a decline thereafter,
leaving prevalence in 2014 to a similar level than it was in 2005. The group that experienced
the most significant decline is the second poorest group for which stunting prevalence went
down from 19.2% in 2005 to 15.5% in 2014.
72


