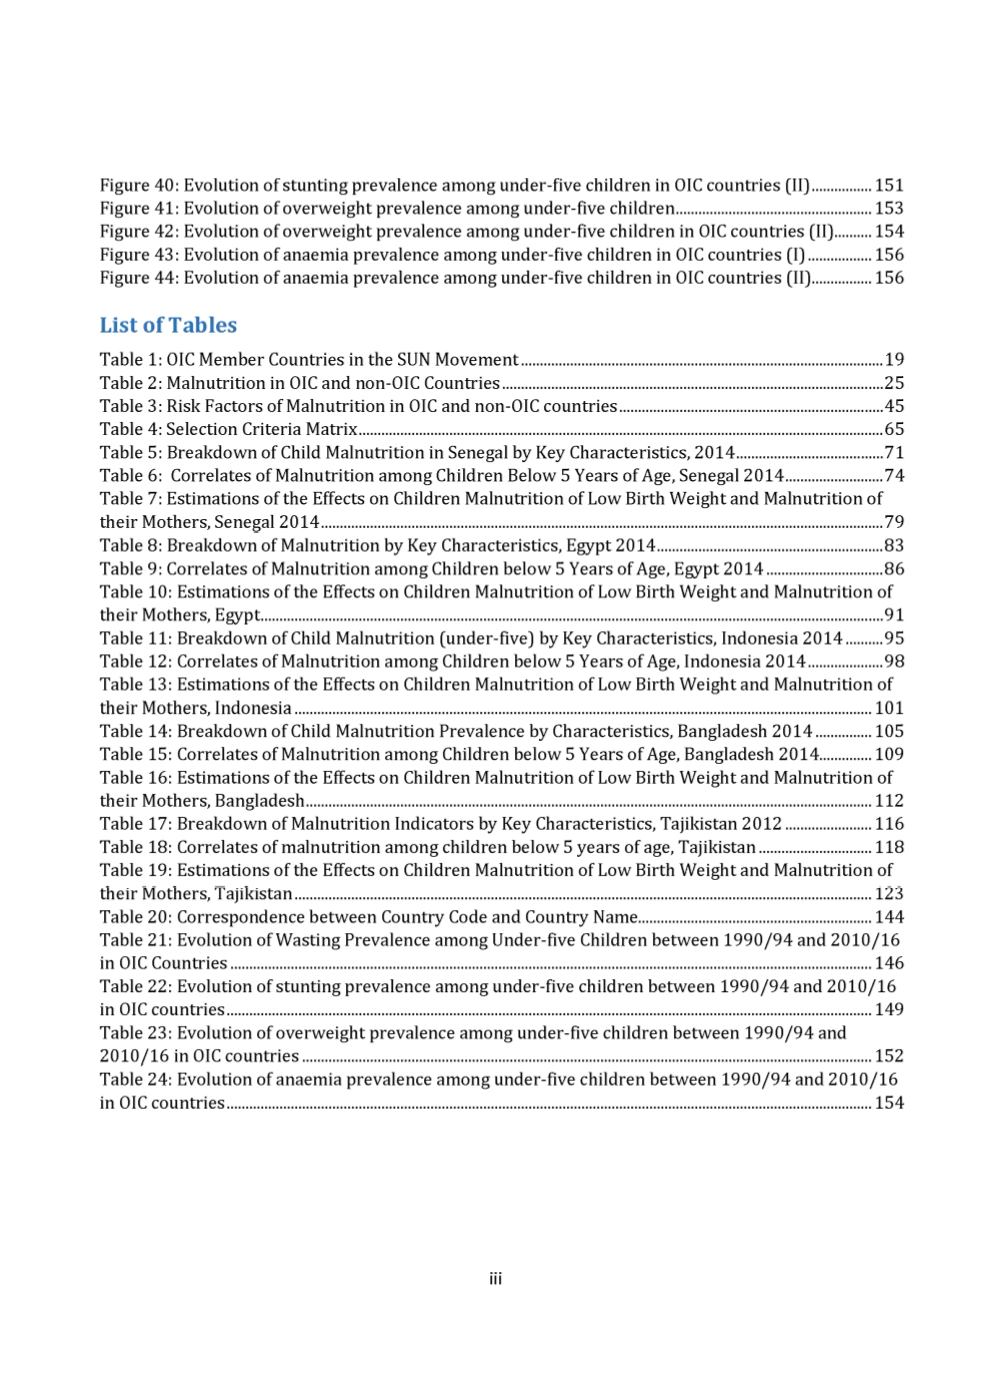

Figure 40: Evolution of stunting prevalence among under-five children in OIC countries (II].............. 151
Figure 41: Evolution of overweight prevalence among under-five children............................................. 153
Figure 42: Evolution of overweight prevalence among under-five children in OIC countries (II]........154
Figure 43: Evolution of anaemia prevalence among under-five children in OIC countries (I]...............156
Figure 44: Evolution of anaemia prevalence among under-five children in OIC countries (II].............. 156
L ist o f Tab les
Table 1: OICMember Countries in the SUNMovement.................................................................................. 19
Table 2: Malnutrition in OIC and non-OIC Countries...................................................................................... 25
Table 3: Risk Factors of Malnutrition in OIC and non-OIC countries............................................................45
Table 4: Selection Criteria Matrix........................................................................................................................65
Table 5: Breakdown of Child Malnutrition in Senegal by Key Characteristics, 2014 ................................. 71
Table 6: Correlates of Malnutrition among Children Below 5 Years of Age, Senegal 2014 ...................... 74
Table 7: Estimations of the Effects on Children Malnutrition of Low Birth Weight and Malnutrition oftheir Mothers, Senegal 2014 .................................................................................................................................79
Table 8: Breakdown of Malnutrition by Key Characteristics, Egypt 2014....................................................83
Table 9: Correlates of Malnutrition among Children below 5 Years of Age, Egypt 2014 .......................... 86
Table 10: Estimations of the Effects on Children Malnutrition of Low Birth Weight and Malnutrition oftheir Mothers, Egypt.............................................................................................................................................. 91
Table 11: Breakdown of Child Malnutrition (under-five] by Key Characteristics, Indonesia 2014 ........ 95
Table 12: Correlates of Malnutrition among Children below 5 Years of Age, Indonesia 2014 ................. 98
Table 13: Estimations of the Effects on Children Malnutrition of Low Birth Weight and Malnutrition oftheir Mothers, Indonesia.................................................................................................................................... 101
Table 14: Breakdown of Child Malnutrition Prevalence by Characteristics, Bangladesh 2014 ............. 105
Table 15: Correlates of Malnutrition among Children below 5 Years of Age, Bangladesh 2014............ 109
Table 16: Estimations of the Effects on Children Malnutrition of Low Birth Weight and Malnutrition oftheir Mothers, Bangladesh..................................................................................................................................112
Table 17: Breakdown of Malnutrition Indicators by Key Characteristics, Tajikistan 2012 ...................116
Table 18: Correlates of malnutrition among children below 5 years of age, Tajikistan.........................118
Table 19: Estimations of the Effects on Children Malnutrition of Low Birth Weight and Malnutrition oftheir Mothers, Tajikistan.................................................................................................................................... 123
Table 20: Correspondence between Country Code and Country Name......................................................144
Table 21: Evolution ofWasting Prevalence among Under-five Children between 1990/94 and 2010/16in OIC Countries..................................................................................................................................................146
Table 22: Evolution of stunting prevalence among under-five children between 1990/94 and 2010/16in OIC countries..................................................................................................................................................149
Table 23: Evolution of overweight prevalence among under-five children between 1990/94 and2010/16 in OIC countries...................................................................................................................................152
Table 24: Evolution of anaemia prevalence among under-five children between 1990/94 and 2010/16
in OIC countries..................................................................................................................................................154
iii


