
Malnutrition in the OIC Member
Countries: A Trap for Poverty
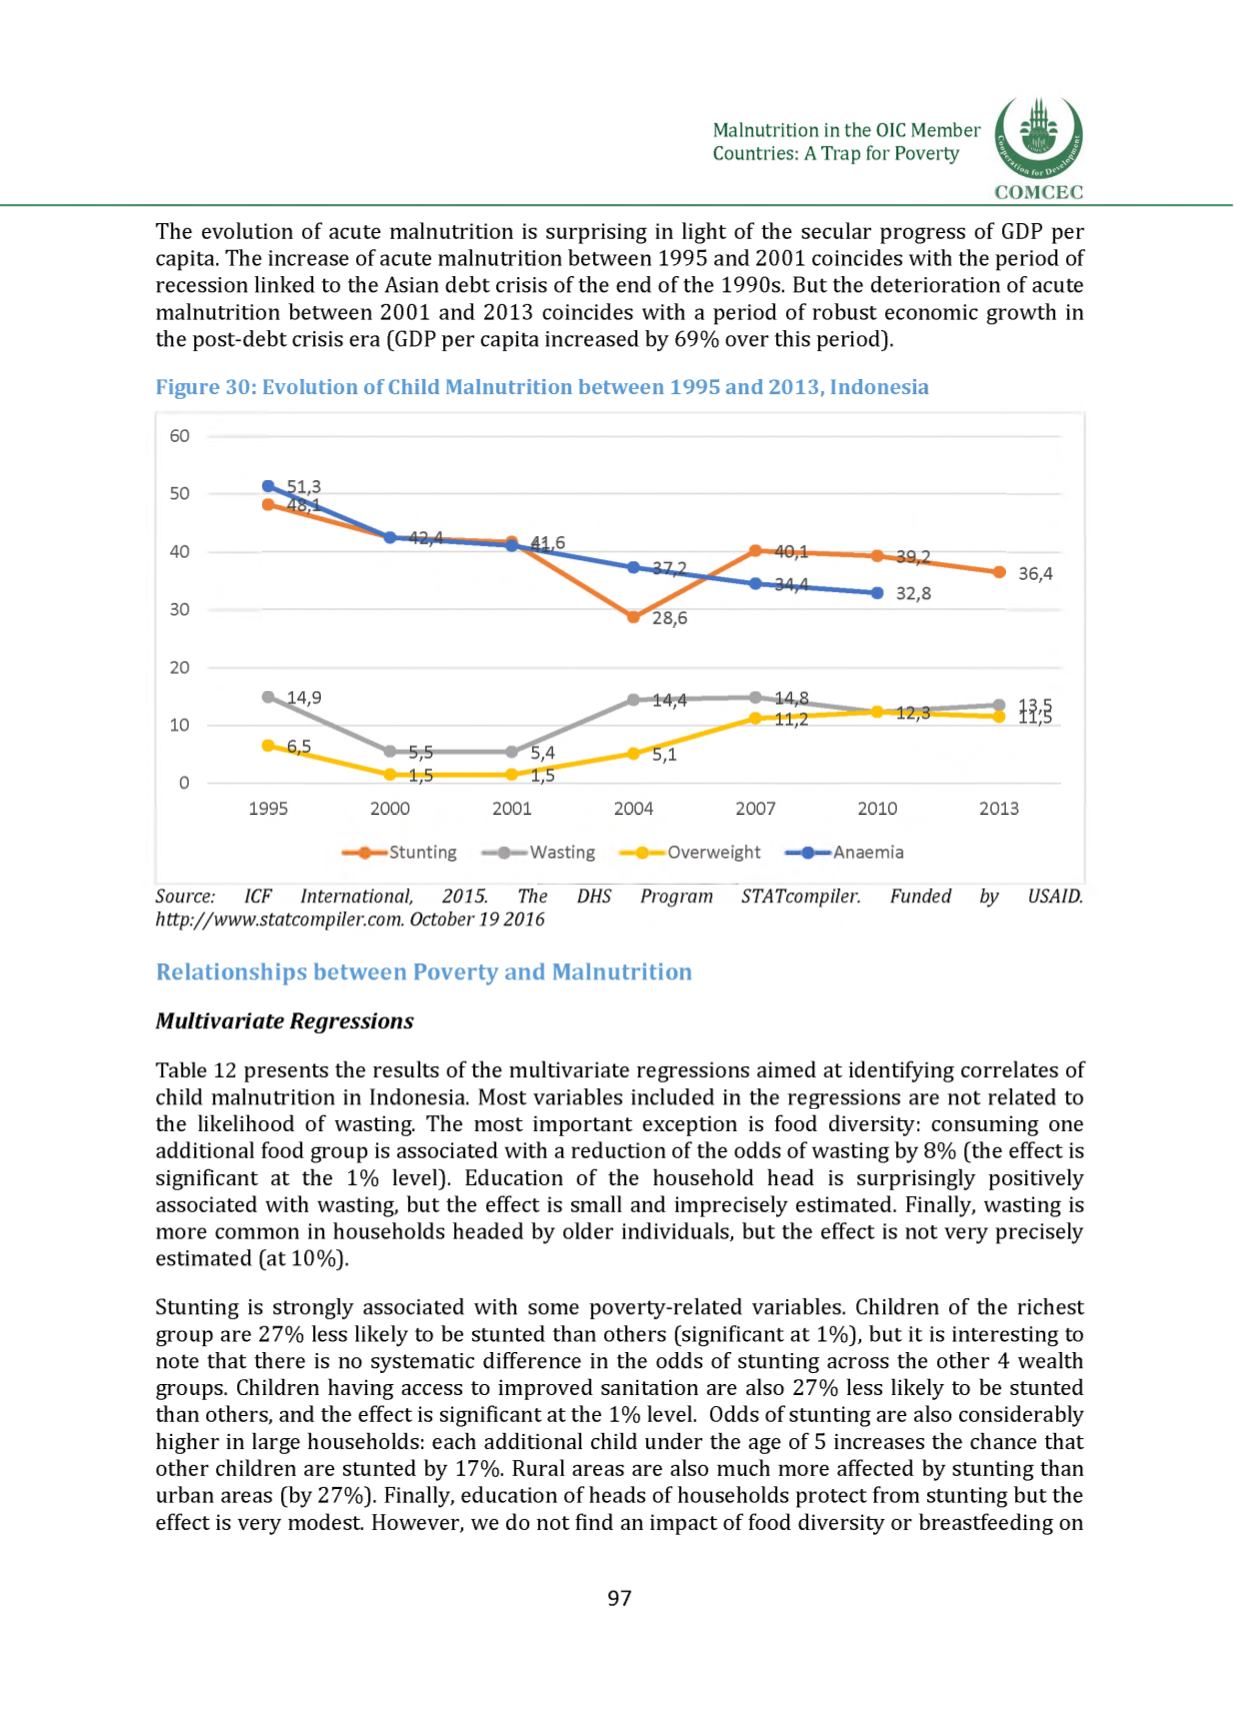
The evolution of acute malnutrition is surprising in light of the secular progress of GDP per
capita. The increase of acute malnutrition between 1995 and 2001 coincides with the period of
recession linked to the Asian debt crisis of the end of the 1990s. But the deterioration of acute
malnutrition between 2001 and 2013 coincides with a period of robust economic growth in
the post-debt crisis era (GDP per capita increased by 69% over this period).
Figure 30: Evolution of Child Malnutrition between 1995 and 2013, Indonesia
60
50
40
30
20
36,4
Stunting
9
Wasting
< Overweight
< Anaemia
Source:
ICF International,
2015.
The
DHS
Program
STATcompiler.
Funded by
USAID.
http://www.statcompiler.com.October 19 2016
Relationships between Poverty and Malnutrition
Multivariate Regressions
Table 12 presents the results of the multivariate regressions aimed at identifying correlates of
child malnutrition in Indonesia. Most variables included in the regressions are not related to
the likelihood of wasting. The most important exception is food diversity: consuming one
additional food group is associated with a reduction of the odds of wasting by
8
% (the effect is
significant at the
1
% level). Education of the household head is surprisingly positively
associated with wasting, but the effect is small and imprecisely estimated. Finally, wasting is
more common in households headed by older individuals, but the effect is not very precisely
estimated (at
1 0
%).
Stunting is strongly associated with some poverty-related variables. Children of the richest
group are 27% less likely to be stunted than others (significant at 1%), but it is interesting to
note that there is no systematic difference in the odds of stunting across the other 4 wealth
groups. Children having access to improved sanitation are also 27% less likely to be stunted
than others, and the effect is significant at the 1% level. Odds of stunting are also considerably
higher in large households: each additional child under the age of 5 increases the chance that
other children are stunted by 17%. Rural areas are also much more affected by stunting than
urban areas (by 27%). Finally, education of heads of households protect from stunting but the
effect is very modest. However, we do not find an impact of food diversity or breastfeeding on
97


