
Malnutrition in the OIC Member
Countries: A Trap for Poverty
COMCEC
Stunting
Wasting Overweight
Anaemia
Wealth quintile: Middle
35.2
7.8
1.9
32.4
Wealth quintile: Fourth
34.5
8. 1
1. 8
30.2
Wealth quintile: Highest
29.1
9
2.4
26.7
Region: North Sumatra
39.7
9.2
1. 8
2 1 . 6
Region: West Sumatra
31.6
6
1.2
13.5
Region: South Sumatra
36.1
10. 2
0.4
35.6
Region: Lampung
31.1
11.9
2. 2
24.2
Region: DKI Jakarta
31.7
7.7
1.9
33.3
Region: West Java
32.9
6.2
1.5
30.8
Region: Central Java
30.7
10.5
2.5
33.9
Region: DI Yogyakarta
26.7
8. 1
3.8
34.8
Region: East Java
33.0
7
2 . 8
26.7
Region: Bali West Nusa
29.9
3.9
1.4
30.3
Region: Tenggara
48.8
10.5
1.0
53.7
Region: South Kalimantan
45.6
7.8
1.9
34.4
Region: South Sulawesi
38.2
10 . 1
1.5
41.6
Mean
35.3
8.5
1.9
31.1
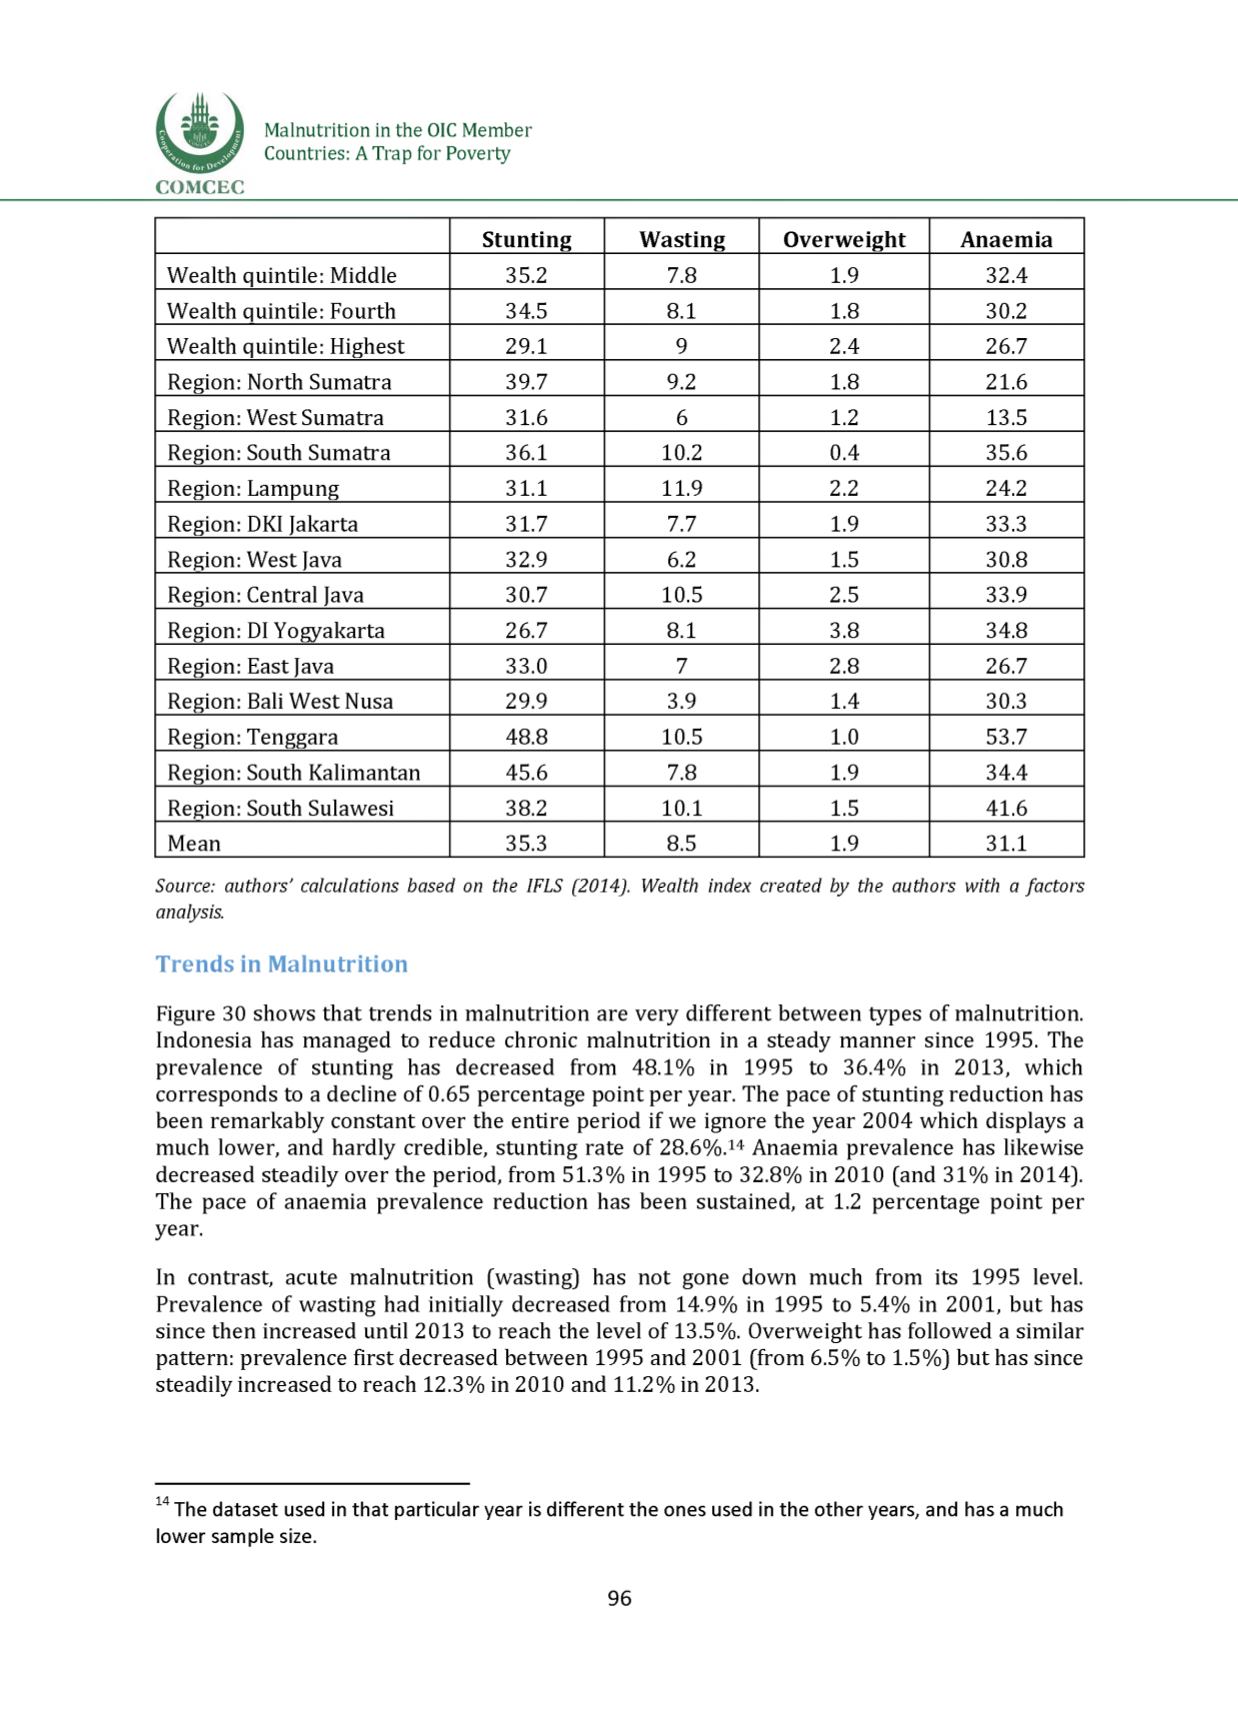
Source: authors' calculations based on the IFLS (2014). Wealth index created by the authors with a factors
analysis.
Trends in Malnutrition
Figure 30 shows that trends in malnutrition are very different between types of malnutrition.
Indonesia has managed to reduce chronic malnutrition in a steady manner since 1995. The
prevalence of stunting has decreased from 48.1% in 1995 to 36.4% in 2013, which
corresponds to a decline of 0.65 percentage point per year. The pace of stunting reduction has
been remarkably constant over the entire period if we ignore the year 2004 which displays a
much lower, and hardly credible, stunting rate of 28.6%.14 Anaemia prevalence has likewise
decreased steadily over the period, from 51.3% in 1995 to 32.8% in 2010 (and 31% in 2014].
The pace of anaemia prevalence reduction has been sustained, at 1.2 percentage point per
year.
In contrast, acute malnutrition (wasting] has not gone down much from its 1995 level.
Prevalence of wasting had initially decreased from 14.9% in 1995 to 5.4% in 2001, but has
since then increased until 2013 to reach the level of 13.5%. Overweight has followed a similar
pattern: prevalence first decreased between 1995 and 2001 (from 6.5% to 1.5%) but has since
steadily increased to reach 12.3% in 2010 and 11.2% in 2013.
14The dataset used in that particular year is different the ones used in the other years, and has a much
lower sample size.
96


