
64
The HTP led to a number of impressive health outcome improvements. For example, average life
expectancy at birth increased from 72.5 years in 2002 to 78 years in 2017, bringing it on par with the
WHO European regional average, and above average compared to upper middle-income countries and
global average (Turkey statistical yearbook). Child andmaternal health indicators, especiallymortality
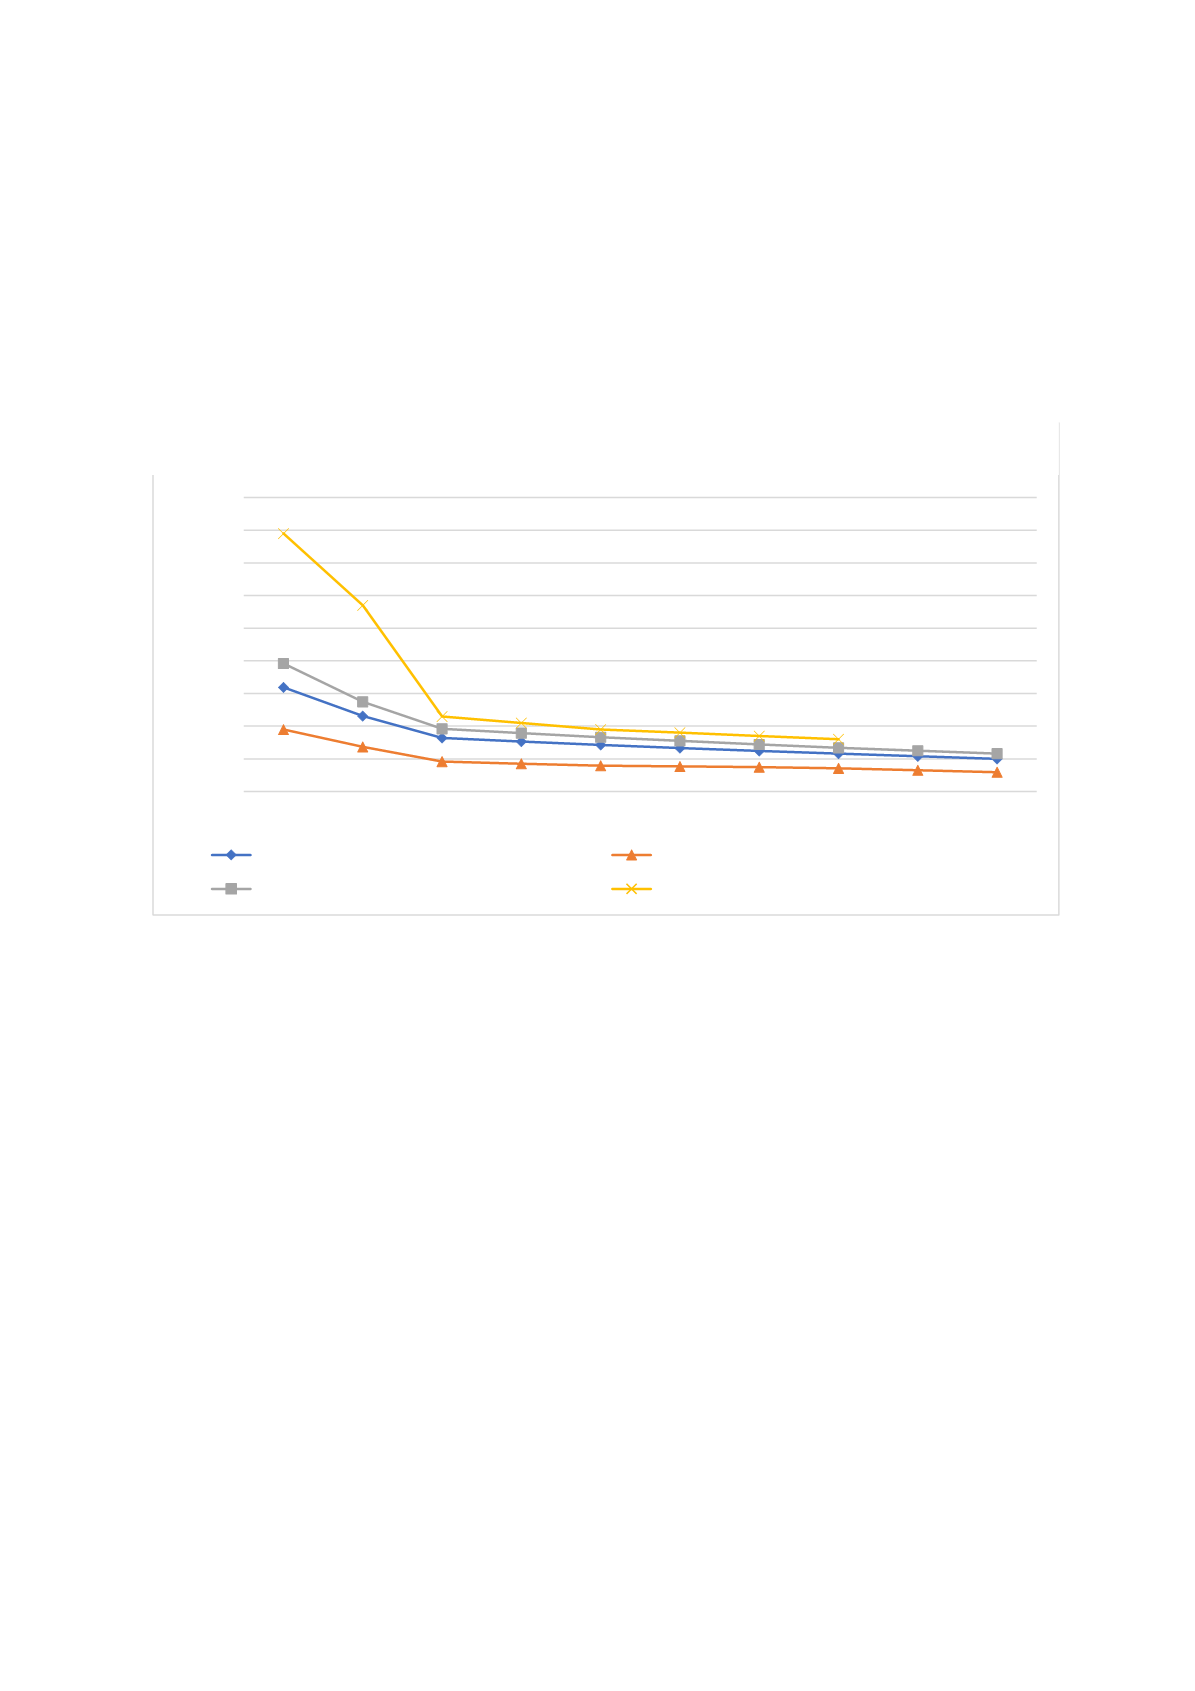
rates, greatly improved (see
Figure 33): maternal mortality rates dropped to about a sixth from 97 to
16 per 100,000 live births between 2000 and 2015 and infant, neonatal and under-5 mortality rates in
2017 had dropped to a fifth of their original values in 2000.
These improvements through the HTP’s combination of increasing health insurance coverage,
expanding benefits, and reducing cost-sharing on the one hand, and expanding infrastructure, health
human resources, and health services on the other hand, were not restricted to richer parts of the
population. Prior to the health reforms, “even those who were insured did not have adequate and equal
access to health services” (Giovanis and Ozdamar, 2017, p. 3). However, with the expanding supply of
health services, the increase in efficiency and decreasing out-of-pocket expenditures (see
Figure 34below), health outcomes such as infant and child mortality rates improved for all wealth brackets (se
e Figure 35 ), with the lowest income groups catching up most.
31,9
10
19
5,9
39,2
11,6
79
16
0
10
20
30
40
50
60
70
80
90
2000 2005 2010 2011 2012 2013 2014 2015 2016 2017
Mortality rates
Child and maternal mortality rates between 2000 - 2017
infant mortality rate (per 1,000 live births)
neonatal mortality rate (per 1,000 live births)
under-5 mortality rate (per 1,000 live births)
maternal mortality rate (per 100,000 live births)
Source: World Development Indicators
Figure 33 Evolution of child and maternal mortality rates in Turkey between 2000 and 2017


