


 118 / 253

106
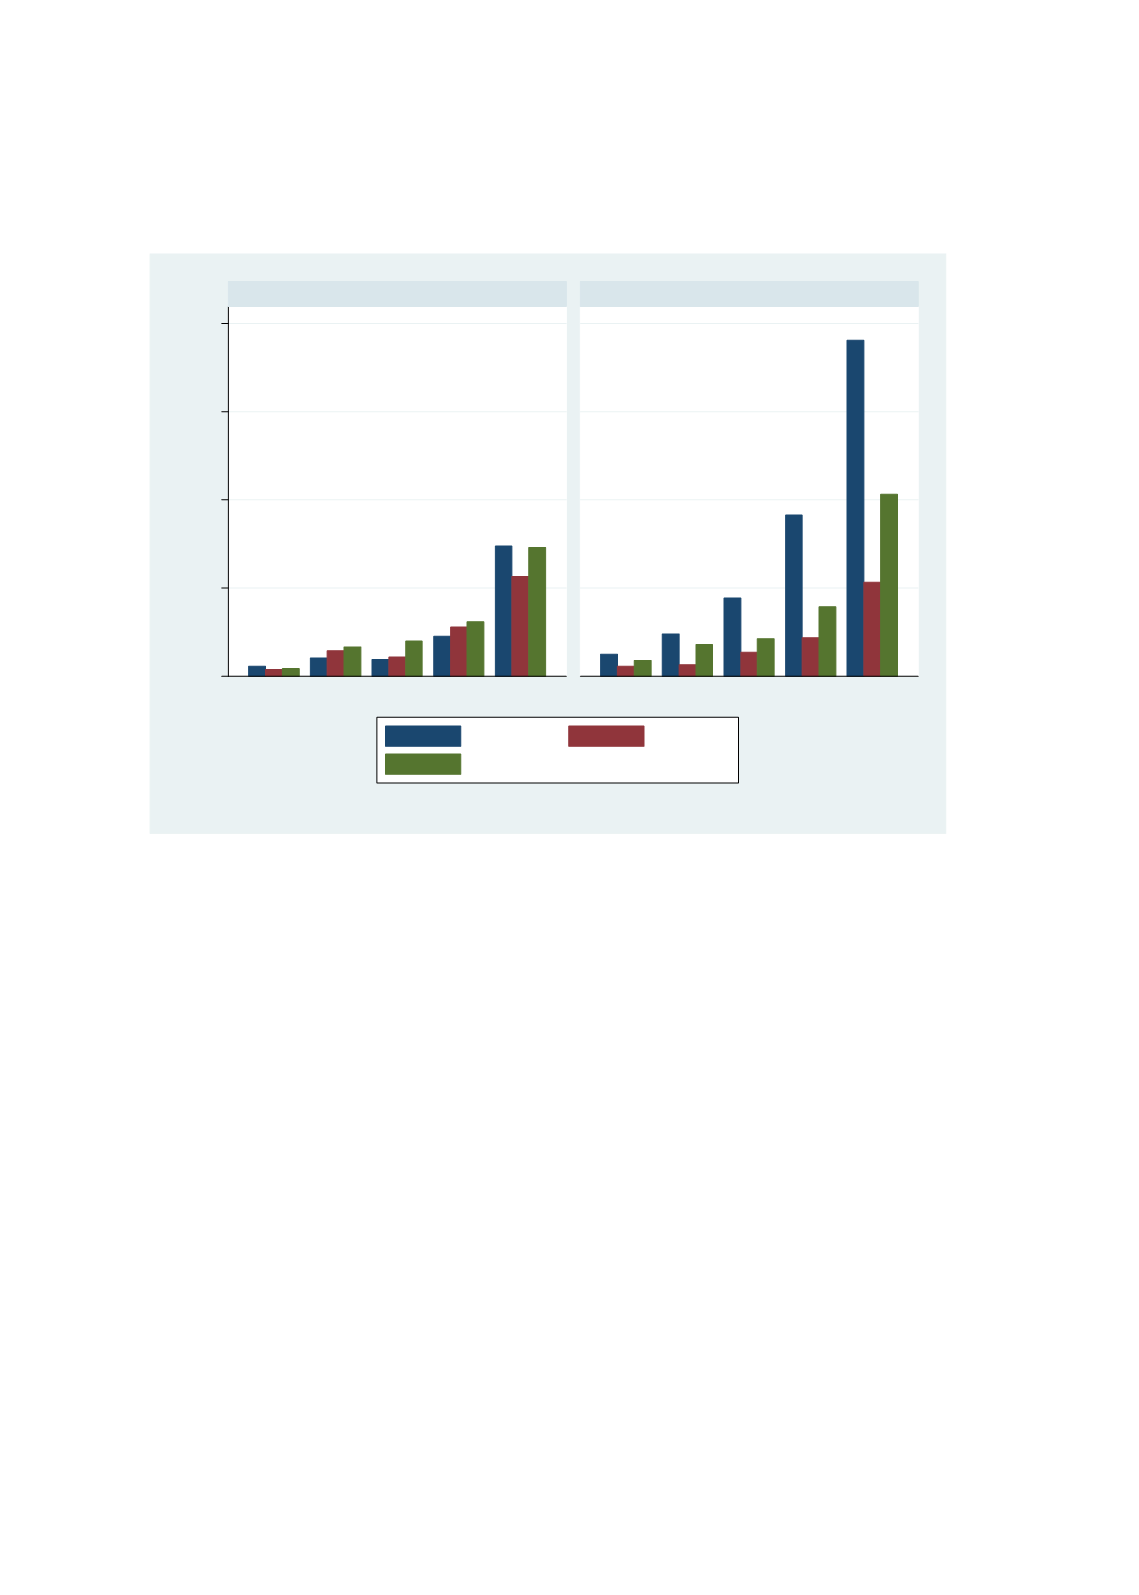
Figure 3.2.9: Trends in Level-4 Competency in Math, Reading and Science in PISA by Family
Wealth, 2009-2012 (Malaysia)
Source:
Authors based on WIDE database
In case of science performance in PISA, the situation is slightly better. In science and reading,
performance is stable across wealth quintiles between 2009 and 2012 in basic proficiency (level
1) (
Figure 3.2.8
). However, in math, there is a sharp increase in performance among children
from the poorest and richest wealth quintiles by 2012. The wealth gap is also the largest in case
of math followed by science and reading. In higher order competency (level 4), wealth gap used
to be large in mathematics and science (in 2009) (
Figure 3.2.9
). However, performance has
increased across all wealth groups in mathematics by 2012, however, the increase is largest in
the top wealth quintile.
The wealth gap is also acknowledged in the Malaysia Education Blueprint (2013-2025) and the
government already has schemes to eliminate this inequity through various initiatives such as
providing financial assistance to disadvantaged students (KWAPM financial aid). However, the
evidence consistently demonstrates that students from poor families are less likely to perform
than students from middle-income or high-income households. Schools with higher
concentrations of low income students were more likely to fall in Band 6 or 7 on the NKRA scale.
Similarly, more than three-quarters of all high performing schools have less than a third of their
students on financial aid. It appears that the largest achievement gaps in Malaysia are still those
driven by socio-economic status, despite the government’s significant investments thus far
(
Appendix Figure 8
). The performance of
Orang Asli
and K9 Schools also declined from a
cumulative grade point of 3.65 in 2015 to 4.31 in 2016 in tandem with the regression in the
mastery rate for UPSR papers from 45.6% in 2015 to 43.8% in 2016 (MOE, 2016).
0
.05
.1
.15
.2
1
2
3
4
5
1
2
3
4
5
Country Wealth Index Quintiles, 2009 Country Wealth Index Quintiles, 2012
Maths
Reading
Science
Graphs by category and year