


 115 / 253

103
socio-economic status. At present, about 65 percent of the school principal has undergraduate
degree while 35 percent has postgraduate education. Teachers also underwent professional
learning, training in terms of higher order thinking skills and assessment. The schools that have
positive learning environment and principals shows more improvement in terms of scores
(MOE, 2016). Nonetheless, a long-term upward trend in student performance is still lacking.
However, Malaysia PISA scores still remain well below the OECD average.
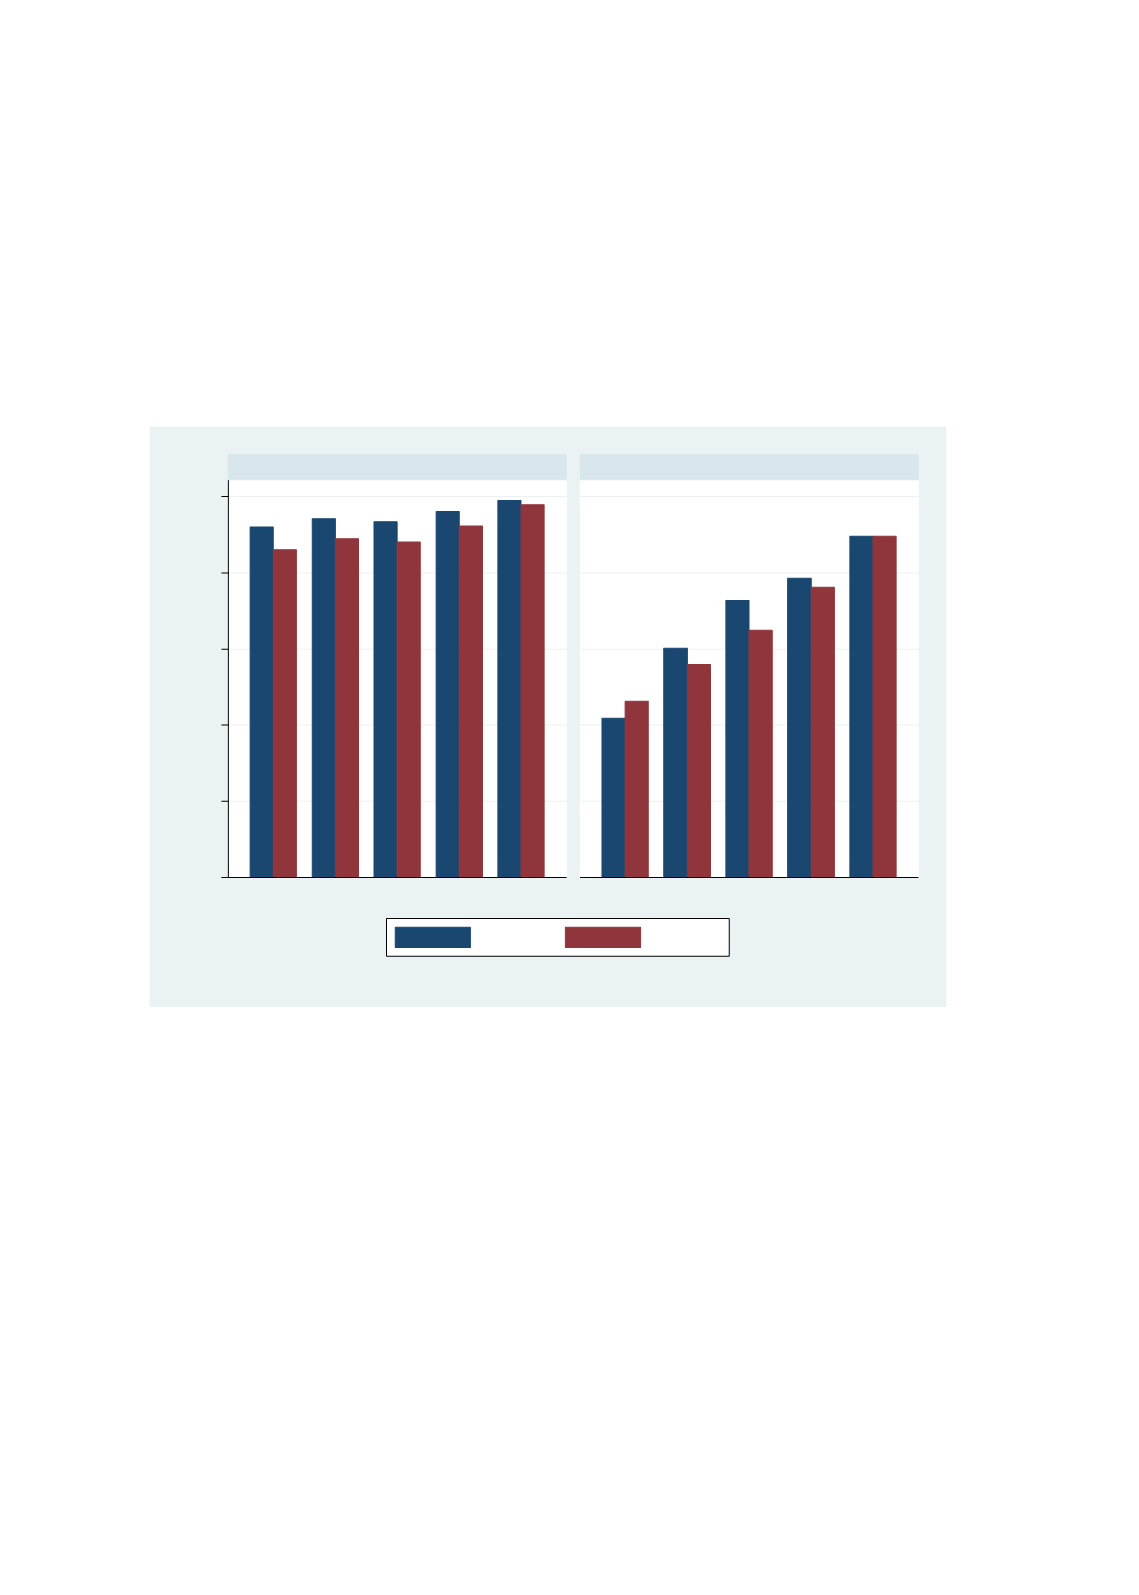
Figure 3.2.5: Trends in Level-1 Competency in Math and Science in TIMSS by Family Wealth,
1999-2011 (Malaysia)
Source:
Authors’ calculation based on WIDE database
The low level of learning aside, there is also concern about socio-economic inequality in student
achievement.
Figure 3.2.5
presents data on trends in Malaysian students’ performance in basic
proficiency (in terms of percentage of children attaining level-1 competency threshold) in Math
and Science in TIMSS by family wealth for the period 1999-2011. In mathematics, there is a clear
decline in performance across all wealth groups by 2011. This is a matter of concern considering
the fact that performance decline relates to basic proficiency. In 1999, over 80% children from
the wealthiest quintile in Malaysia attained basic proficiency in math.
By 2011, it is still more than 80% among the top wealth quintile. The decline is even bigger
among the poorest wealth group (by almost 50 percentage points). The across-wealth groups
decline in math is even more pronounced in case of attainment of level-2 proficiency (Figure
3.2.2). At level 3 threshold (advanced competency), the sharpest fall in attainment occurred
among the top wealth quintile – it dropped fromover 6% in 1999 to less than 2% in 2011 (Figure
3.2.3).
0
.2
.4
.6
.8
1
1
2
3
4
5
1
2
3
4
5
Country Wealth Index Quintiles, 1999 Country Wealth Index Quintiles, 2011
Maths
Science
Graphs by category and year